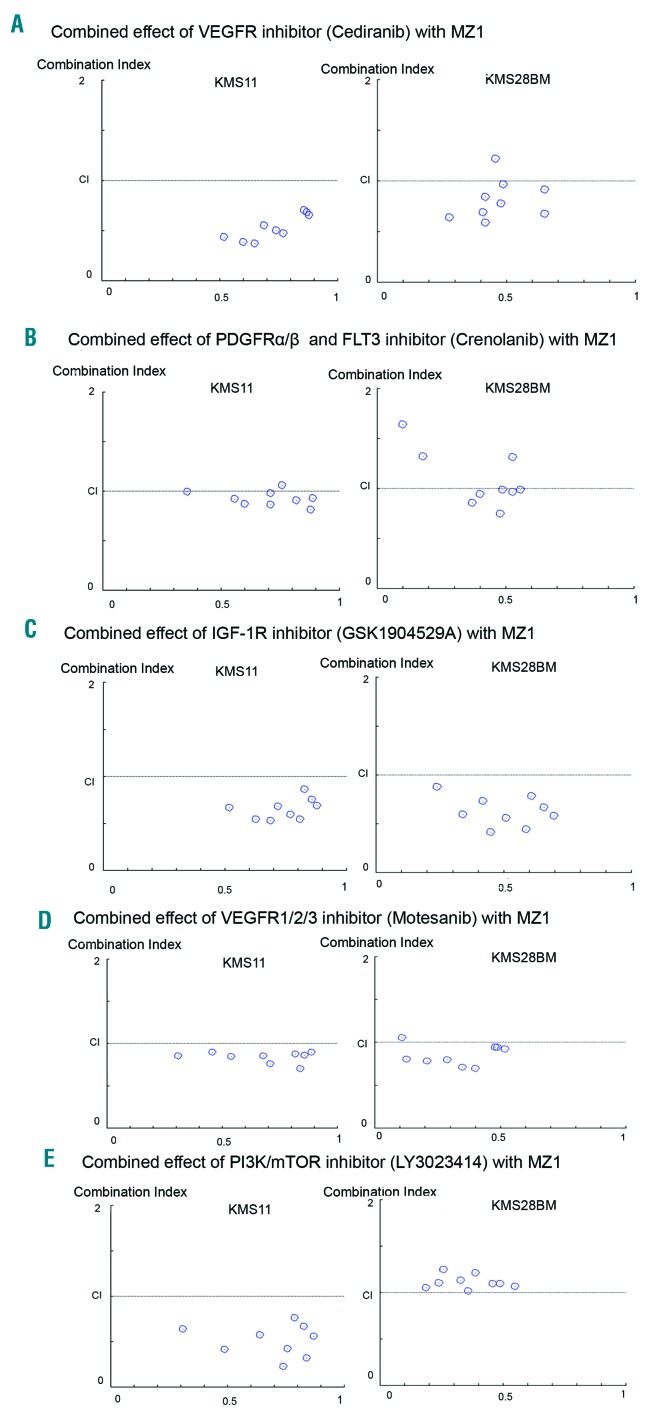
Figure 6.
Combination Index (CI) plot of MZ1 with small molecule inhibitors. Synergistic growth inhibition of KMS11 and KMS28BM multiple myeloma cells in the presence of MZ1 and small molecule inhibitors as measured by MTT assay. CI defines interaction between MZ1 and small molecule inhibitor as plotted against a fraction of cell viability. CI<1, CI=1, and CI>1 represent synergism, additive, and antagonism of the two compounds, respectively. Values of CI analysis are shown in Online Supplementary Table S4.

