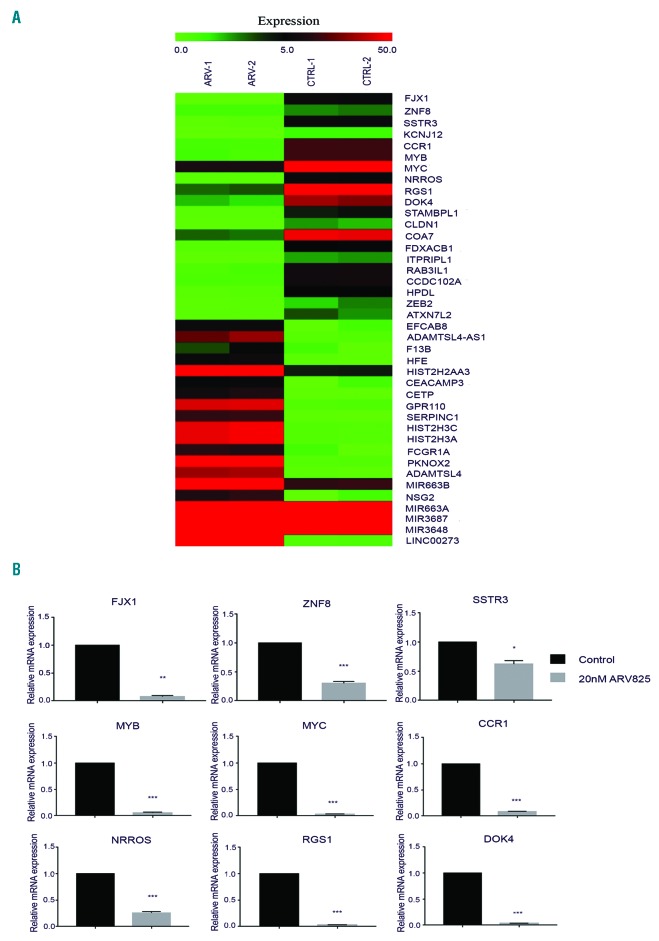
Figure 7.
RNA sequencing to obtain profile of gene expression. (A) Heatmaps show top 20 down- and up-regulated genes upon ARV 825 treatment [20 nM ARV 825, 8 hours (h)] of KMS11 MM cells. Results of two replicates from each group are shown. (B) Level of mRNA of nine genes were validated by quantitative realt-time polymerase chain reaction. (These genes were chosen because their expression levels were altered as viewed by RNA-sequencing). Expression of each gene was normalized to b-actin as a reference (control value converted to the value of 1). *P≤0.01; **P≤0.001; ***P≤0.0001.

