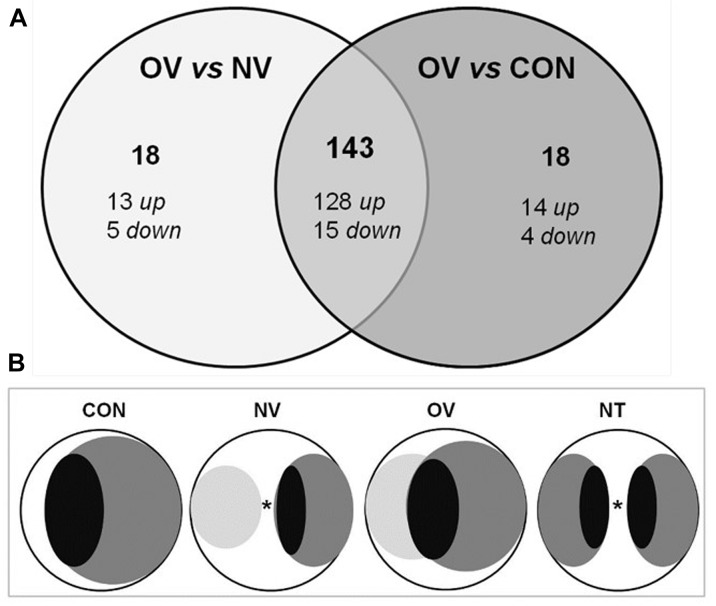
FIGURE 1.
Microarrays data analysis and experimental setup of Trichoderma atroviride T11 against Verticillium dahliae V-138I. (A) Venn diagram of differentially expressed genes within the set of microarray data. Gene significance was assigned to more than twofold change (FDR: 0.15). Comparative analysis is showed for T11 overgrowing V-138I (OV) in comparison with those in T11 grown at 5 mm from V-138I (NV) and in T11 grown alone (CON). Total number of genes and their subgroups of up- and down-regulated genes are showed for each comparative analysis. The intersection between circles displays the total number of genes up- and down-regulated differently expressed under the overgrowing condition (OV). (B) Scheme of the experimental growth conditions designed for the microarrays. T. atroviride T11 and V. dahliae V-138I, that was inoculated 4 days in advance, were grown onto cellophane-covered PDA plates until samples were collected. T11 is drawn in dark gray color and V-138I is delineated in light gray color. Black oval dots represent the sampling areas that were collected for RNA extraction. CON, T11 grown alone; NV, T11 grown at 5 mm from V-138I; OV, T11 overgrowing V-138I; NT, T11 confronted with itself for RTqPCR validation. ∗5-mm space left between both organisms.

