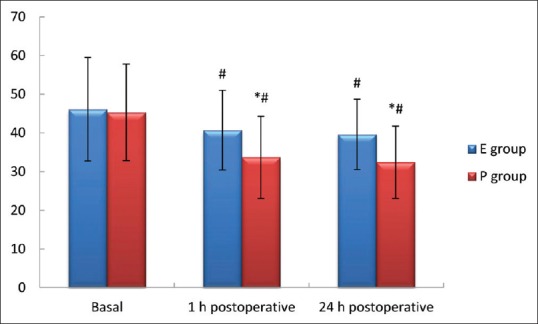
Figure 3.

The prolactin levels of the studied groups (ng/mL) data are in mean ± standard deviation. E = ESP, P = PECS. P<0.05 is significant. *Significant for P in comparison to E, #Significant at 1 h, 24 h postoperative in comparison with basal in same group. ESP = Erector spinae plane, PECS=Pectoral plane block
