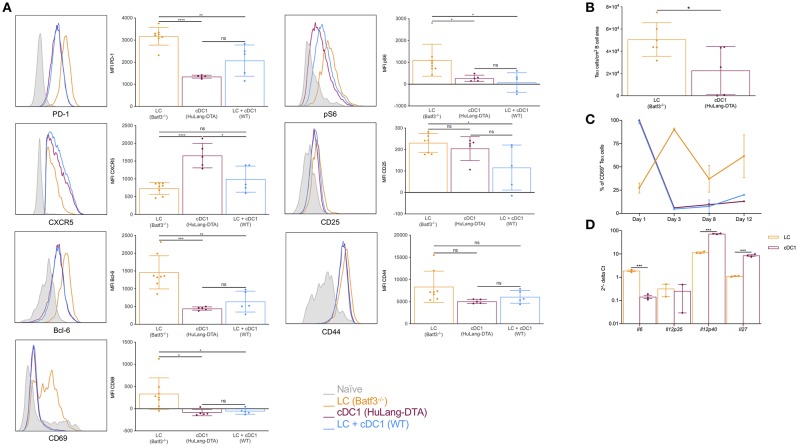
Figure 4.
LCs, unlike cDC1s, promote Tfh cells with GC phenotype; cDC1s might outcompete the LCs on T cell activation levels. (A) Mice were transferred with transgenic TEα cells and immunized through the indicated DC subsets with 1 μg of 4C7-Eα. The phenotype of the TEα cells was assessed by flow cytometry 4 days later, at the peak of the response. Representative flow histograms followed with compiled MFI data from multiple mice. Data from two experiments are shown. Each dot represents a separate mouse. (B) As in (A), but LNs were harvested and the number of TEα cells in the B cell area determined using multicolor histology and ImageJ. Data from one representative experiment out of two is shown. Each dot represents a separate mouse. (C) Similar to (A), but the LNs were harvested at the indicated timepoints and the activation status of the TEα cells determined based on CD69 expression using flow cytometry. Data from one representative experiment out of two is shown. N = 3. (D) Steady state LCs and cDC1s were flow sorted from LNs and their cytokine profile determined by qRT-PCR. Expression levels were normalized to HPRT. Each dot represents a separate mouse. *p < 0.05, **p < 0.01, ***p < 0.001, ns = not significant.

