
Figure 1.
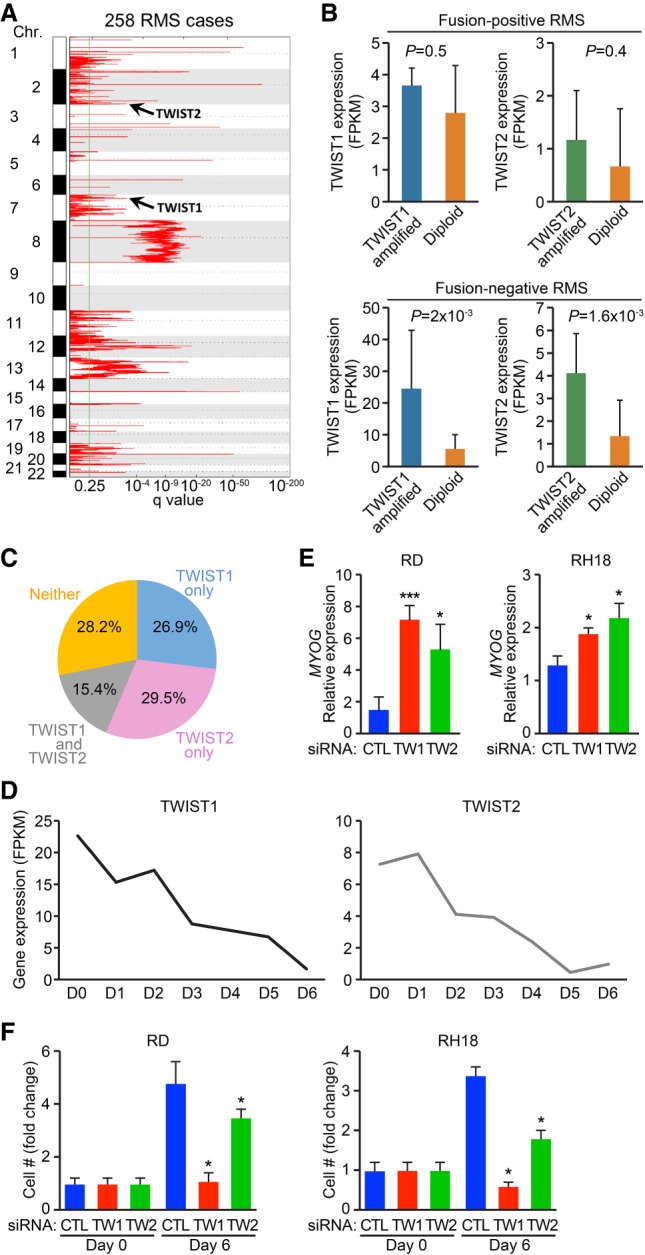
Integrative genomic analysis identifies TWIST genes as potential oncogenes for FNRMS. (A) Charts show genomic regions with statistically significant copy number gains identified by the Genomic Identification of Significant Targets in Cancer 2.0 (GISTIC2) algorithm in 258 RMS cases. Additional amplified loci can be found in Xu et al. (2018). (B) Separate integrated analysis on copy number alterations and gene expression for TWIST1 and TWIST2 genes in fusion-positive (top panel) and fusion-negative (bottom panel) RMS. TWIST expression in patient tumors containing TWIST amplification were compared with those without TWIST amplification (diploid). (C) Venn diagrams display the percentage of RMS cases with copy number amplification events on TWIST1 (blue), TWIST2 (pink), or both (gray). (D) Charts show gene expression for TWIST1 and TWIST2 in human myoblasts cultured in growth medium (D0) or differentiation medium for the indicated number of days (D1–D6). (E,F) Measurement of MYOGENIN expression in RD cells (E, left) or RH18 cells (E, right) or cell proliferation in RD cells (F, left) or RH18 cells (F, right) upon siRNA-mediated knockdown of TWIST2 or TWIST1. Unpaired two-tailed t test: (*) P < 0.05; (***) P < 0.0005.