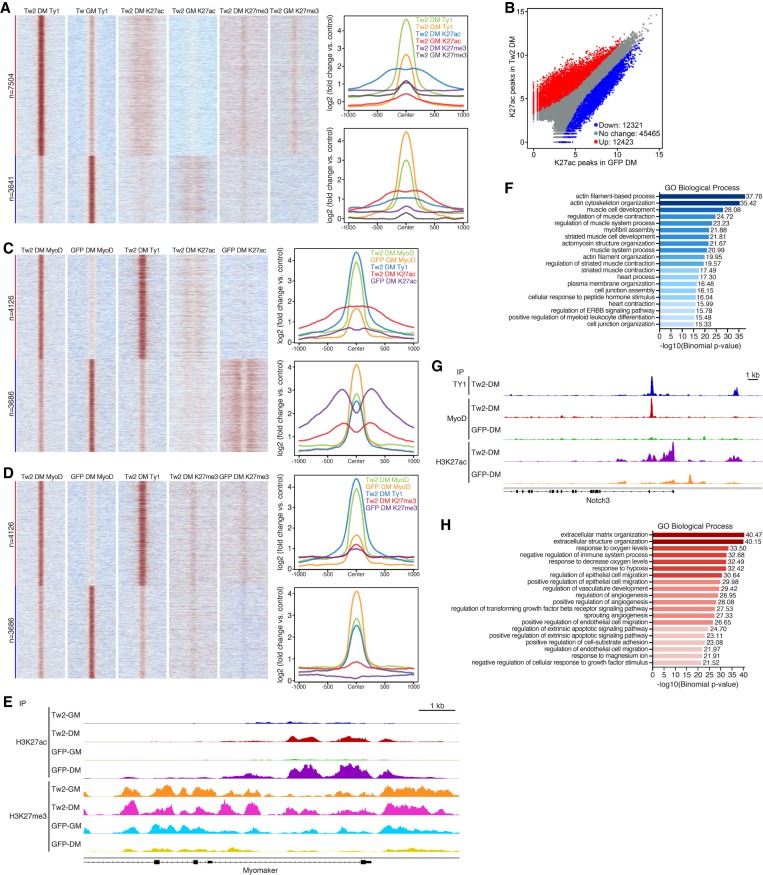
Figure 7.
Twist2 dynamically regulates global chromatin organization during differentiation. (A, left) Heat map depicting differential binding of Twist2 in GM versus DM conditions and the effect on H3K27ac and H3K27me3. (Right) ChIP signal distribution plot of Twist2, H3K27ac, and H3K27me3 peaks associated with up-regulated and down-regulated Twist2 peaks in DM versus GM conditions. (B) Scatter plot depicting differential binding of H3K27ac in the presence and absence of Twist2 in DM. Differential binding cutoff was set at a twofold or greater change and Padj < 0.05. (C, left) Heat map depicting the effect of Twist2 on differential binding of MyoD and H3K27ac. (Right) ChIP signal distribution plot of Twist2, MyoD, and H3K27ac peaks associated with up-regulated and down-regulated MyoD peaks in TW2-DM versus GFP-DM. (D, left) Heat map depicting the effect of Twist2 on differential binding of MyoD and H3K27me3. (Right) ChIP signal distribution plot of TWIST2, MyoD, and H3K27me3 peaks associated with up-regulated and down-regulated MyoD peaks in TW2-DM versus GFP-DM. (E) Genome browser shot depicting H3K27ac and H3K27me3 changes at the Mymk locus during differentiation in the presence and absence of Twist2. (F) GREAT analysis of H3K27ac peaks down-regulated in TW2-DM versus GFP-DM. (G) Genome browser shot depicting gain of H3K27ac and MyoD peaks in the Notch3 locus upon Twist2 binding. (H) GREAT analysis of H3K27ac peaks up-regulated in TW2-DM versus GFP-DM.

