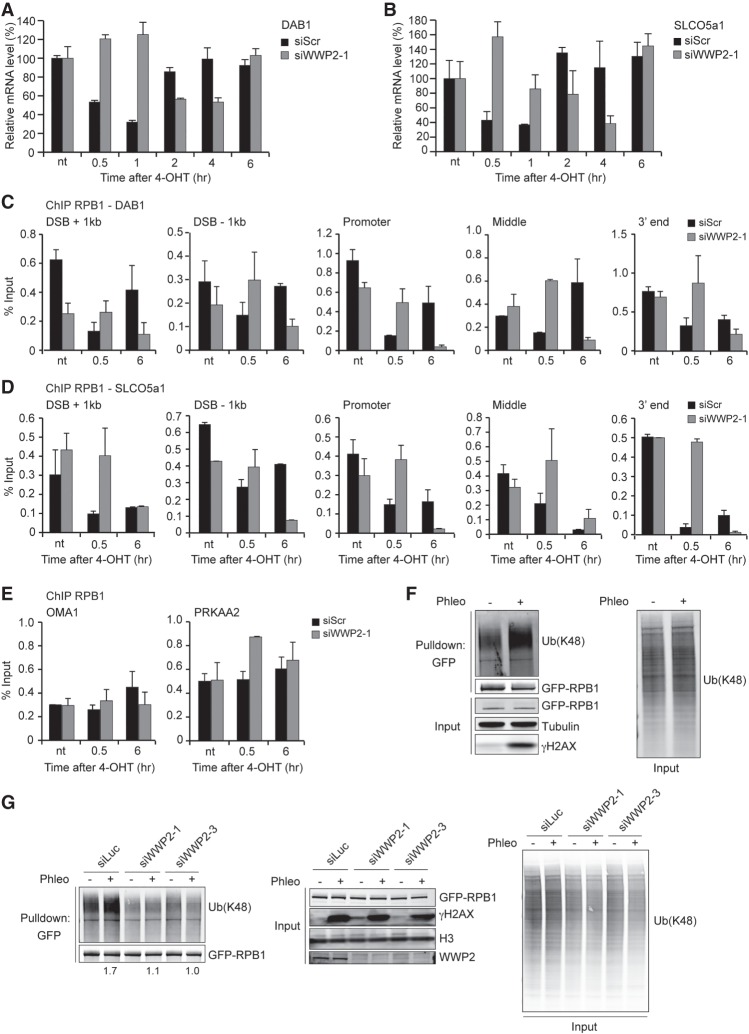
Figure 3.
WWP2 promotes DSB-induced transcription silencing and RPBI ubiquitylation after DNA damage. (A) RT-qPCR analysis of DAB1 expression levels in U2OS HA-ER-I-PpoI cells at the indicated time points after 4-OHT treatment and transfected with the indicated siRNAs. DAB1 mRNA levels were normalized to those of cyclophilin B. The mean ± SD from qPCR replicates of a representative experiment is shown. A repeat of the experiment is shown in Supplemental Figure S8B. (B) As in A, except for SLCO5a1. A repeat of the experiment is shown in Supplemental Figure S8B. (C) ChIP-qPCR against RPB1 in U2OS HA-ER-I-PpoI cells transfected with the indicated siRNAs. RPB1 levels were monitored at the indicated time points after 4-OHT treatment and at the indicated positions at DAB1. The mean ± SD from qPCR replicates of a representative experiment is shown. A repeat of the experiment is shown in Supplemental Figure S8C. (D) As in C, except for SLCO5a1. A repeat of the experiment is shown in Supplemental Figure S8D. (E) ChIP-qPCR against RPB1 in U2OS HA-ER-I-PpoI cells transfected with the indicated siRNAs. RPB1 levels were monitored at the indicated time points after 4-OHT treatment at the OMA1 and PRKAA2 genes. The mean ± SD from qPCR replicates of a representative experiment is shown. A repeat of the experiment is shown in Supplemental Figure S8E. (F) Pull-downs of GFP-RPB1 under denaturing conditions in untreated and phleomycin (Phleo)-treated U2OS cells. Cells were also treated with proteasome inhibitor (MG-132) 25 min before the phleomycin treatment. Blots were probed for Ub(K48), GFP, and γH2AX. Tubulin was used as a loading control. (G) As in F, except that cells were treated with the indicated siRNAs, and blots were also probed for H3. Relative Ub(K48) levels after GFP-RPB1 pull-down from phleomycin-treated versus untreated cells are indicated below the blots.

