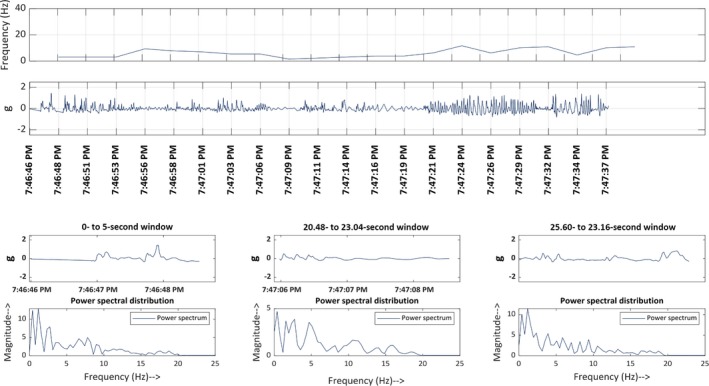
Figure 3.

Time‐frequency plot of a typical psychogenic non‐epileptic event. Line 1: Frequency‐time map: This demonstrates the frequency at which the limb (left in this figure) oscillates for the first 50 s after the start time. Line 2: Acceleration‐time map for the 88 s following the start time. Line 3: Acceleration shown in 2.5‐second epochs, starting at different time points through the 88 s. Line 4: Power‐spectrum distribution. This displays how the frequency‐distribution varied in the corresponding 2.5‐second epochs shown in line 3
