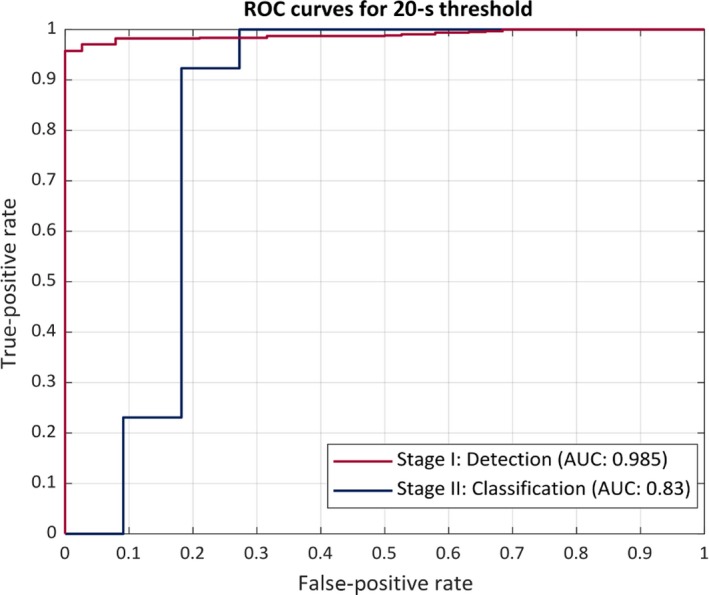
Figure 5.

ROC curve using a 20‐s threshold The receiver operating characteristics curve (ROC) of the proposed system. The performance is in terms of area under the ROC curve (AUC). The red curve represents the performance of the seizure (ES and PNES) detection stage I. The blue curve shows the performance of the seizure classification stage II
