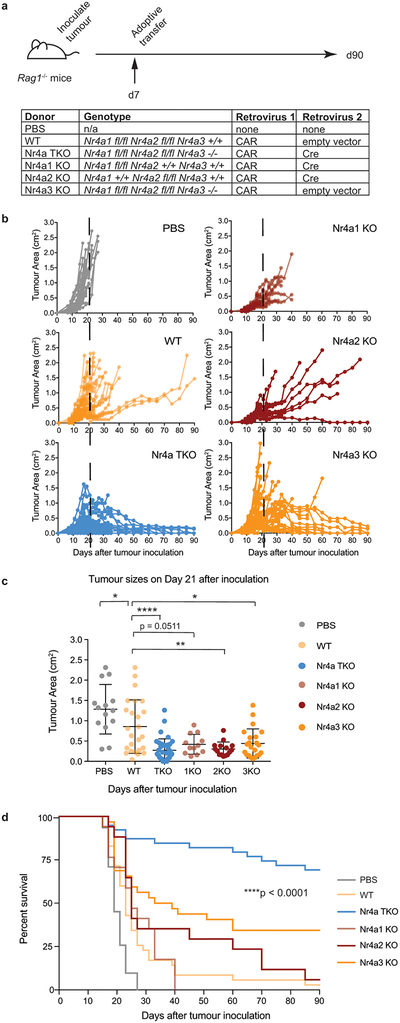
Extended Data Figure 6 |. Tumor-bearing mice adoptively transferred with CAR CD8+ T cells lacking all three Nr4a family members exhibit prolonged survival compared to mice transferred with wildtype CAR CD8+ T cells or CAR CD8+ T cells lacking only one of the three Nr4a family members.
(a) Experimental design; 3×10⁶ WT, Nr4aTKO, Nr4a1KO, Nr4a2KO, or Nr4a3KO CAR-T cells were adoptively transferred into Rag1−/− mice 7 days after tumor inoculation. (b) Growth of B16-OVA-huCD19 tumors in individual mice, comprised of 17 or more mice per condition (these data include the WT and Nr4aTKO data from Figure 3). (c) Graph shows mean ± s.d. and the individual values of B16-OVA-huCD19 tumor sizes at day 21 after inoculation. p-values were calculated using an ordinary one-way ANOVA with Tukey’s multiple comparisons test; PBS vs WT, *p=0.0395; WT vs Nr4a1KO, p=n.s.=0.0511; WT vs Nr4a2KO, **p=0.002, WT vs Nr4a3KO, *p=0.0161; and WT vs Nr4aTKO, ****p<0.0001. (d) Survival curves. **** p< 0.0001, calculated using log-rank (Mantel-Cox) test. Surviving mouse numbers at d7, d21, and d90 were n=31, 14, 0 for PBS; n=35, 25, 1 for WT; n=17, 12, 0 for Nr4a1KO; n=17, 15, 1 for Nr4a2KO; n=32, 22, 11 for Nr4a3KO; and n=39, 36, 27 for Nr4aTKO. For all p-value calculations, *p ≤0.05, **p ≤0.01, ***p ≤0.001, ****p ≤0.0001.

