Figure 5.
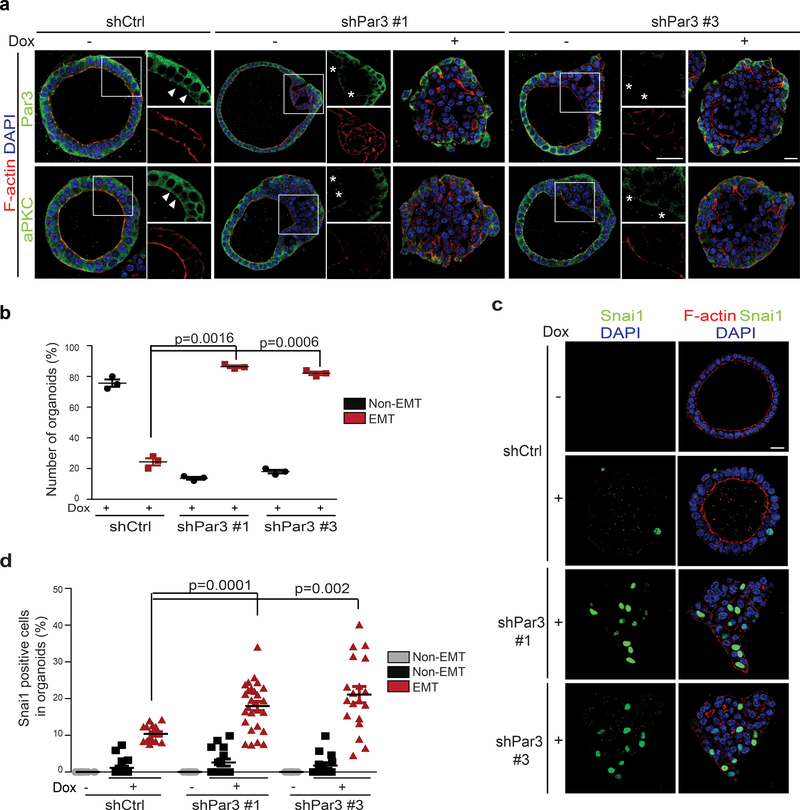
Knockdown of Par3 promotes SNAI1 protein stability and induces EMT in MEOs.
(a) Representative immunofluorescence images for Par3, aPKC, and F-actin in TetON-SNAI1 MEOs expressing control shRFP or shPar3#1 and #3. Arrowheads point to the presence of aPKC at the apical membrane and Par3 at the apical/lateral region. Stars mark the loss of these proteins at the corresponding areas. Scale bars, 25μm and 50μm. Three independent experiments. (b) Quantification of the percentage of non-EMT and EMT TetON-SNAI1 MEOs expressing shRFP or shPar3#1 and #3. n=3 independent experiments with 50 organoids/condition in each experiment, unpaired two-tailed t-test with Welch’s correction. Error bars represent standard deviation. (c) Immunofluorescence images for SNAI1 and F-actin in TetON-SNAI1 MEOs expressing shRFP or shPar3#1 and #3 before and after doxycycline treatment. Scale bars, 25μm. Three independent experiments. (d) Quantification of the percentage of SNAI1-positive cells in non-EMT and EMT TetON-SNAI1 MEOs expressing shRFP or shPar3#1 and #3 before and after doxycycline treatment. n values from left to right: 20, 20, 15, 20, 15, 27, 20, 15 and 19 cells, respectively. Data represent one out of three independent experiments Unpaired two-tailed t-test with Welch’s correction. Error bars represent standard deviation. All immunofluorescence images represent one out of three independent experiments. Source data for graphs can be found in Supplementary Table 3.

