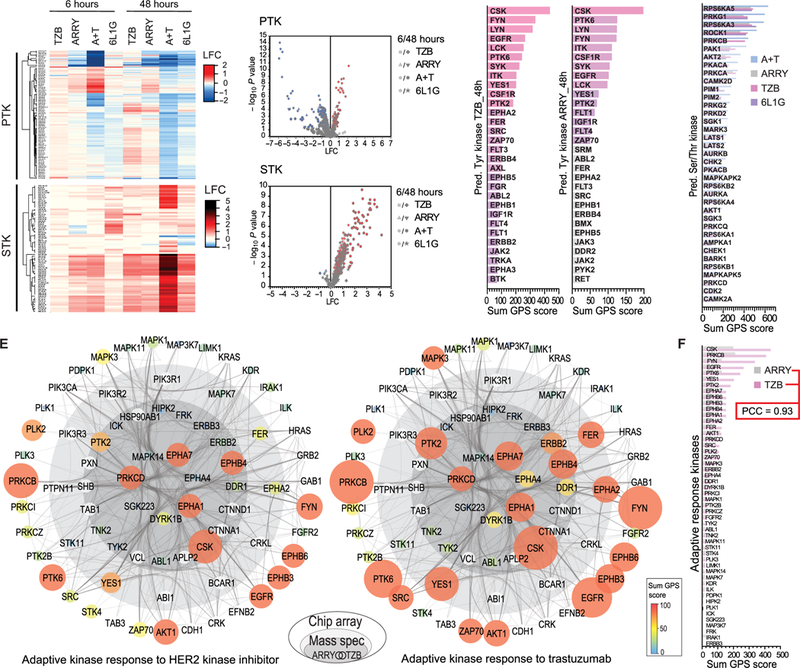
Fig. 3. Peptide chip array, cognate kinase prediction, and combined adaptive kinase response analysis in BT474 cells.

(A) Heat map of up- and down-regulated Tyr (PTK, top) and Ser/Thr (STK, bottom) bait peptide phosphorylation versus DMSO treatment by peptide chip array (n=4 biological replicates). BT474 cells were treated the same as in Fig. 1B. (B) Volcano plots of the bait peptide phosphorylation from PTK (top) and STK (bottom) chip arrays in (A), which shows significantly up- and downregulated peptide phosphorylation as defined by ANOVA and post-hoc Dunnett’s test versus DMSO treatment (p≤ 0.05). (C-D) Sum of scores from group-based prediction system (GPS) based on significantly upregulated phosphorylation of Tyr- (C) and Ser/Thr- (D) bait peptides (as determined in B). (E) Combined adaptive kinase response analysis in onion diagram representation, depicting adaptive signaling proteins (as nodes) based on co-appearance in TMT data and in the set of predicted kinases from peptide chip array data after 48 hours’ treatment with ARRY (left) or TZB (right) in a high-confidence interaction network (edges) from String DB. Inner core (dark grey) represents proteins from the consensus of the 54 persistently phosphorylated Tyr peptides after ARRY and TZB treatment from the TMT data (Fig. 2C). Middle layer (light grey) represents remaining hits form same TZB treatment (Fig. 2C). Node size and color indicates sum of GPS scores (predicted active) from indicated treatment (from C and D). Outer layer (white) represents String DB interactions to additional predicted kinases (from C and D) after TZB treatment. (F) Comparison of the upregulated Tyr- and Ser/Thr- kinases from (E).
