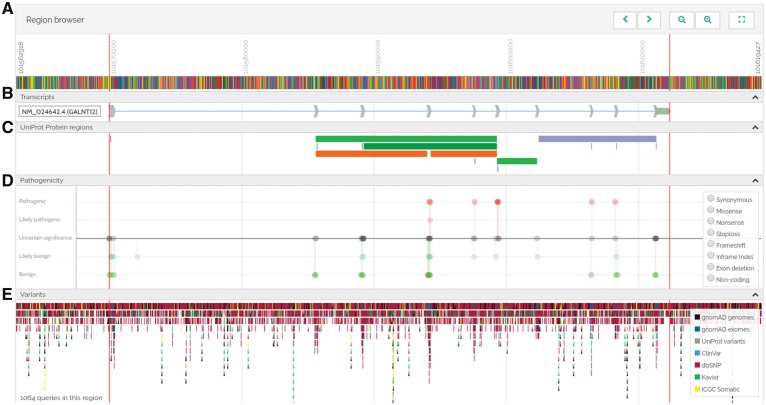
Fig. 1.
VarSome genome browser. (A) Sequence (zooming in shows individual base pairs) and position. (B) Transcripts’ exonic structure and orientation. (C) Regions of interest in the protein (binding sites, functional domains, etc.) taken from UniProt. (D) Lollipop graphs indicating the pathogenicity of known variants in the region. (E) Known variants in the region

