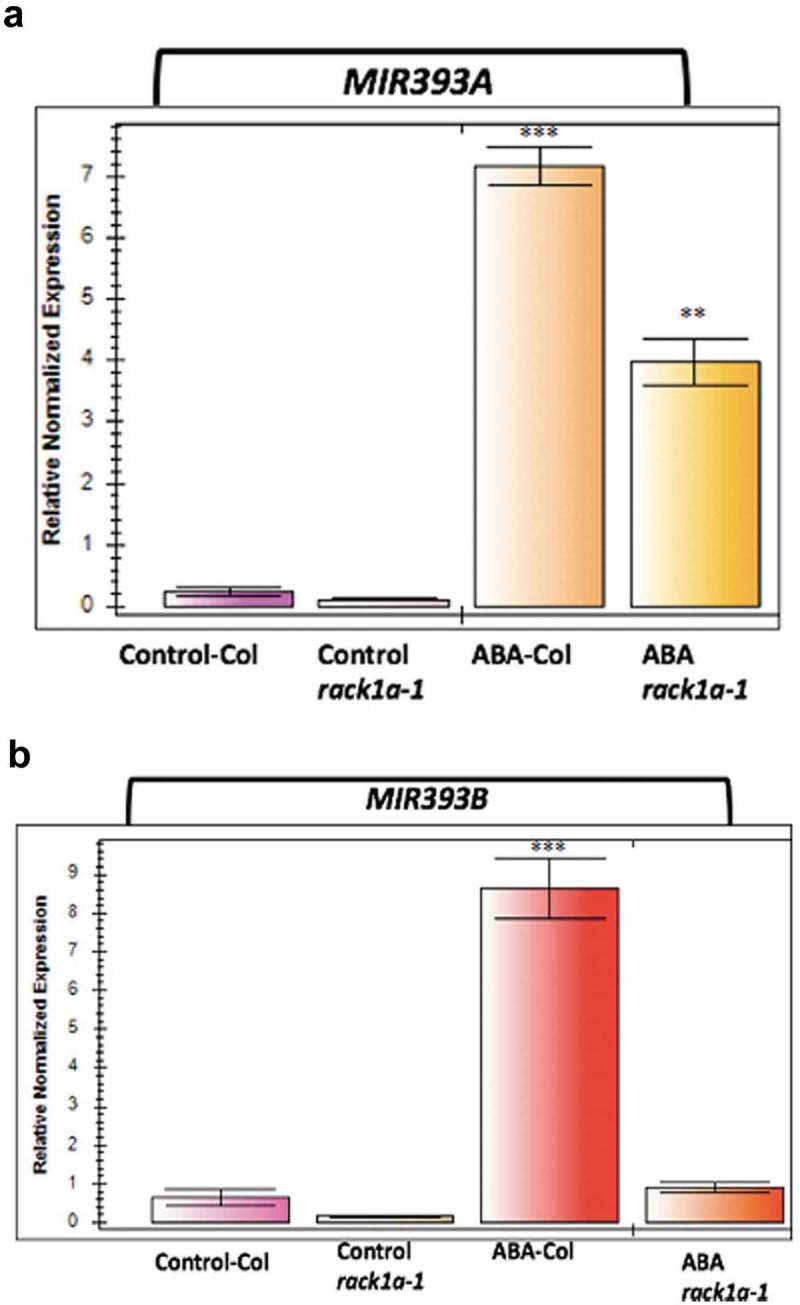
Figure 2.

ABA treatment induced miR393 transcripts expression. qPCR analysis of miR393A (panel A) and miR393B (panel B) in response to exogenous ABA (0.5 mM). Quantifications were normalized to the expression of house-keeping gene Actin. The error bars represent standard deviation from three PCR replicate experiments. MS plate grown two-weeks old seedlings were transferred to MS plates containing ABA or methanol (vehicle control) and RNA were isolated after additional two weeks of growth. Asterisks denote significant difference from the control plants (** and *** denotes p < 0.05, p < 0.01, respectively, Student’s t-test).
