
FIGURE 2. Effect Sizes for all Subcortical and Cortical Partitions in a Mega-Analysis of Brain Morphometry in Patients With Autism Spectrum Disorder (ASD) and Healthy Control Subjectsa.
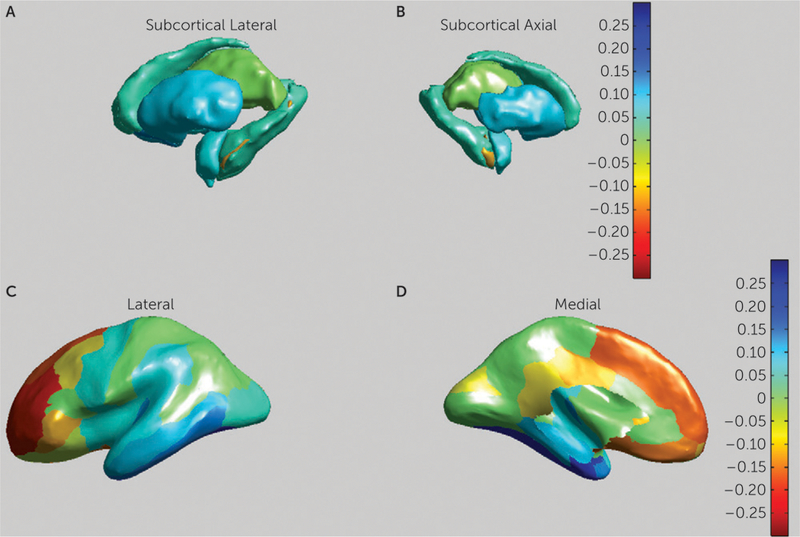
a Panels A and B are medial and lateral views of the striatum. Panels C and D are medial and lateral views of cortical thickness. Yellow to red hues indicate higher d values, corresponding to larger volumes in patients with ASD. Blue hues indicate lower volumes in subjects with ASD. Images are in Montreal Neurological Institute space (MNI152).