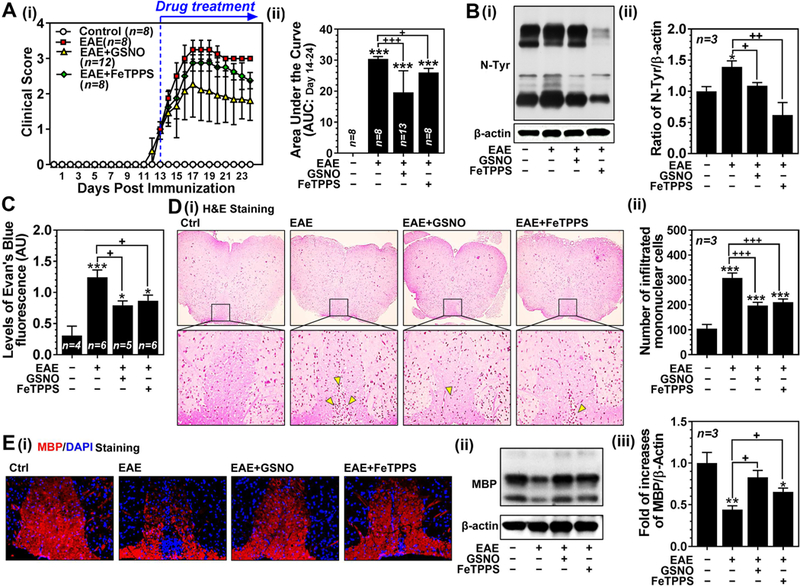
Figure 7. Roles of GSNO and FeTPPS on clinical disease, expression of 3-nitrotyrosine, BBB leakage, and spinal cord demyelination in mouse EAE model.

A. Clinical score of control C57BL/6 mice (Ctrl: n=8), C57BL/6 mice immunized with MOG35–55 peptide (EAE: n=8), EAE mice treated with 1mg/kg/day of GSNO (EAE+GSNO: n=12) or 30 mg/kg/day of FeTPPS (EAE+FeTPPS: n=8) was determined daily as described in Materials and Methods (A-i). All drugs were administered starting at the day of disease onset (day 13 post-immunization) via intraperitoneal routes. The area under the curve (AUC) between post immunization day 14 and 24 of the overall disease severity was calculated and represented as bar graph (A-ii). B. At 24 day post-immunization, the mice (n=3) were sacrificed and the levels of 3-nitrotyrosine (N-Tyr), as an index of ONOO−, were measured by Western (B-i) and densitometry analysis (B-ii). C. In addition, another set of mice were injected with Evans blue for analysis of BBB leakage. D. Spinal cord infiltration of mononuclear cells was analyzed by H&E staining of paraffin-embedded spinal cord section (D-i). The number of mononuclear cells (dark-brown nuclei aggregates indicated by yellow triangles) was counted manually and represented by bar graph (D-ii). E. The spinal cord sections and tissue lysates were also subjected to immunofluorescent staining (E-i) and Western analysis for MBP (E-ii and -iii) for degree of demyelination. Data are expressed as mean ± standard deviation. *p ≤ 0.05, ** p ≤ 0.01, *** p ≤ 0.001 vs. control and + p ≤ 0.05, ++ p ≤ 0.01, and +++ p ≤ 0.001 vs. EAE.
