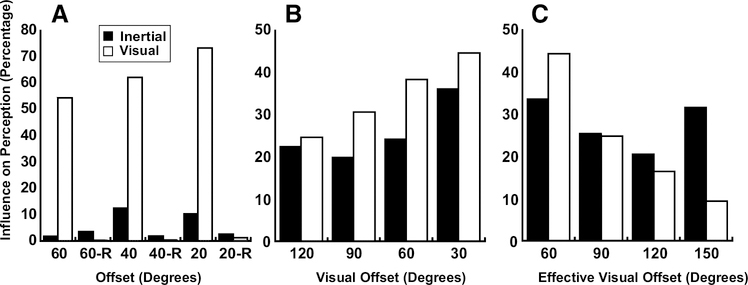
Figure 11.
White bars are the percentage inertial heading perception changed due to visual stimuli. Black bars are the percentage visual heading perception changed due to inertial stimuli. A. Experiment 1: as visual-inertial offset increased, the influence of visual stimuli on inertial perception decreased. B. Experiment 2: visual influence on inertial perception continued to decrease with larger offsets. A. (-R tag) Experiment 3: negligible visual influence on inertial perception. C. Experiment 4: visual influence on inertial perception decreased as effective visual offset increases.

