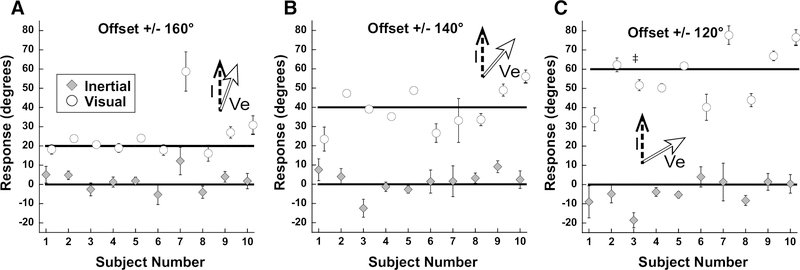
Figure 8.
Results of experiment 3 by subject. Values represent the average of all inertial offsets tested. All subjects perceived the visual and inertial stimuli in separate directions. Error bars represent ±1 SEM and if not shown are smaller than the plot symbol. ‡: significant shift in heading perception vs 0° offset in negative offset (i.e. −30°), but not negative offset (i.e. +30°). Significance measured using rmANOVA; Bonferroni test.

