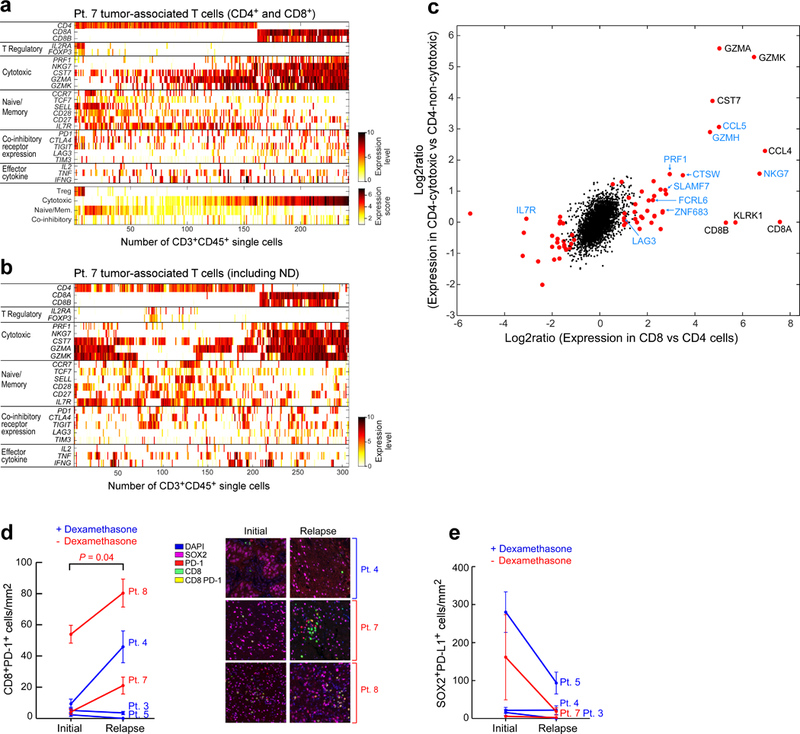
Extended Data Fig. 6 |. Analysis of tumour-associated T cells from patient 7.

a, Expression levels (log2(TPM/10 + 1)) of selected marker genes for regulatory, cytotoxic and naive/memory T cell phenotypes; and expression of co-inhibitory receptors and effector cytokines based on scRNA-seq of tumour-associated CD4+ and CD8+ T cells from the relapse specimen of patient 7 (top). The average levels of these gene sets were used to define the expression scores of these signatures (bottom). b, Expression levels of selected marker genes for all tumour-associated CD3+ T cells from patient 7, including those unable to be resolved as CD4 or CD8 based on scRNA-seq. ND, not determined. c, Expression program associated with cytotoxicity in CD8+ (x axis) and CD4+ (y axis) T cells. For CD8, we compared all CD8+ T cells to non-Treg CD4+ T cells. For CD4, we divided the non-Treg CD4+ T cells by their average expression of a predefined cytotoxic signature (PRF1, NKG7, GZMK, GZMA and CST7) into three groups (low, medium and high) and compared the high to the low groups. The expression log2 ratios of all expressed genes for these two comparisons (CD8 and CD4) are shown. To identify significant differences, we performed a one-sided permutation test, which shuffled the assignments of cells to groups 100,000 times and defined P values based on the number of times the shuffled log2 ratios are higher (or lower for negative effects) than the observed log2 ratios. P values were adjusted by Bonferroni correction and significant genes were defined as those with an adjusted P value below 0.05 and a fold change above 2 (Supplementary Table 10). Significant genes are shown as red dots; significant genes that have also been identified previously9 are shown in blue font. d, Multiplex immunofluorescence demonstrates increase in CD8+PD-1+ cell infiltration at relapse in patients who did not receive dexamethasone during vaccine priming (red). Infiltrates were determined by enumerating the mean number of CD8+PD-1+ cells in 20× fields. The number of fields evaluated per sample was: 4 fields for relapse samples from patients 7 and 8; 5 fields for initial and relapse samples from patient 3, relapse samples from patient 5 and initial samples from patient 8; and 6 fields for initial and relapse samples from patient 4, and initial samples from patients 5 and 7. Data are mean ± s.e.m. P values are two-sided and based on model F-tests. e, Enumeration of the SOX2+PD-L1+ cells in matched initial and relapse tumour sections, evaluated by multiplex immunofluorescence. Infiltrates were determined by enumerating the mean number SOX2+PD-L1+ cells in 20× fields as in d. Data are mean ± s.e.m.
