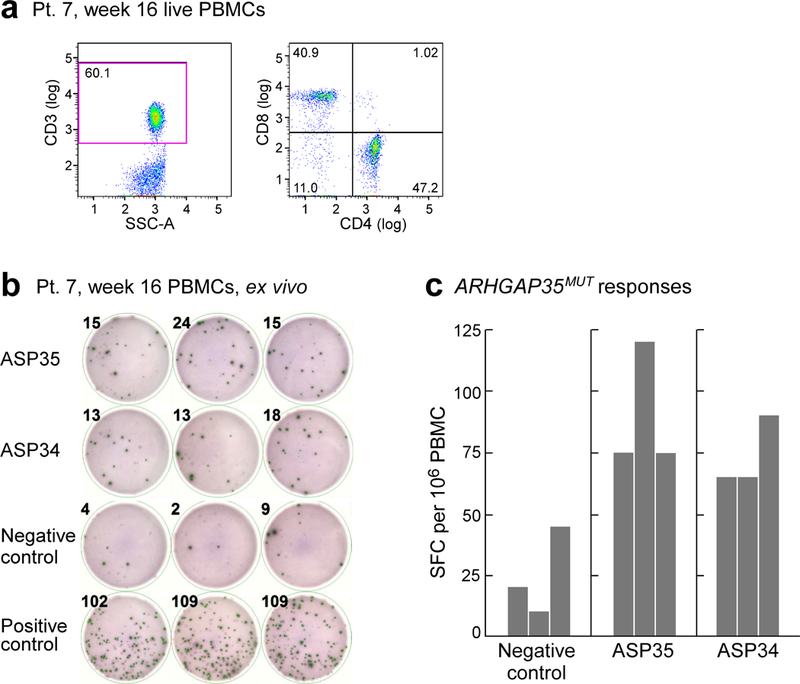
Extended Data Fig. 9 |. Detection of ARHGAP35MUT-specific T cells in patient 7, week 16.

a, Thawed PBMCs from week 16 collected from patient 7 revealed 60% of the live PBMCs to be CD3+ T cells. Data are representative of results from two independent experiments. b, Thawed PBMCs from patient 7 at week 16 were tested ex vivo by ELISPOT, in which 2 × 10⁵ PBMCs were added per well and exposed overnight to 10 μg ml−1 of peptides covering ARHGAP35MUT (ASP34 or ASP35 peptides) compared to negative control (OVA peptide). Experiment was performed once in triplicate wells. c, Results of ex vivo ELISPOT (n = 3 biologically independent samples). Together, these results indicate that the frequencies of ASP35- and ASP34-reactive T cells were 39 and 29 (after subtracting background) per 360,000 T cells, respectively. Detection of ASP35-reactive T cells (F10) and ASP34-reactive T cells (H02) in brain at relapse was 1 each among 277 single intracranial T cells (Fig. 4c). The rate of T cells that recognize immunizing neoantigens is highly enriched in the brain compared to the periphery, P = 0.030 for ASP35 and P = 0.023 for ASP34, two-sided Poisson test.
