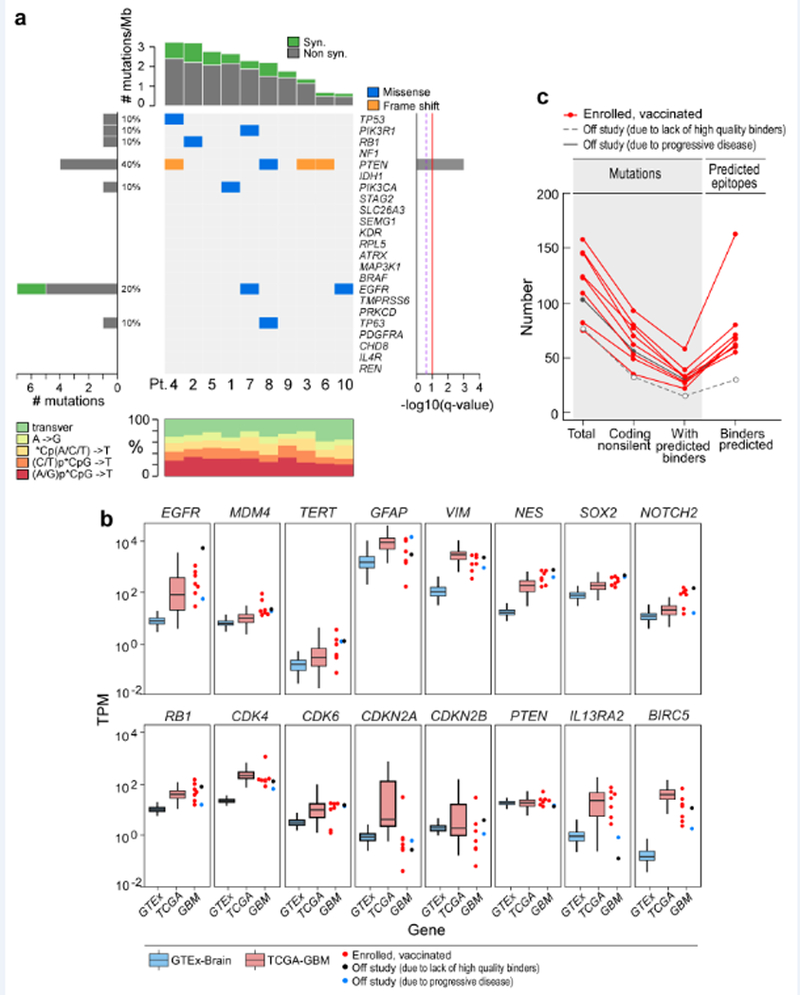
Extended Data Fig. 1 |. Mutational landscape of patient GBM tumours.

a, The overall mutational landscape of the GBM tumours from 10 enrolled patients (top, number of mutations per Mb; bottom, distribution of nucleotide changes) and the presence of mutations in genes that have previously been identified as recurrent in GBM TCGA samples (n = 290) by the MutSig2CV algorithm51 (middle; genes are ordered on the basis of the significance of recurrence reported in the TCGA). b, Expression profiles of the GBM specimens from patients at study entry, according to RNA-seq analysis (Methods). This analysis revealed that tumour samples from the patients showed: EGFR upregulation (consistent with EGFR amplification and polysomy 7), MDM4 upregulation (consistent with p53 pathway dysregulation), TERT upregulation, upregulation of genes associated with glial intermediate filaments (for example, GFAP, VIM and NES), upregulation of markers of GBM stemness (for example, SOX2 and NOTCH2), Rb pathway dysregulation (for example, RB1, CDKN2A and CDKN2B downregulation and CDK4 and CDK6 upregulation), PTEN downregulation (consistent with monosomy 10) and upregulation of IL13RA2 and BIRC5 (which encodes survivin). Tumour RNA-seq data were available for 9 out of 10 study subjects (red dots, vaccinated, n = 7; blue dots, not included in study because of progressive disease, n = 1; black dots, not included in study because of insufficient numbers of binders, n = 1) and were normalized as transcripts per million base pairs (TPM). These data were compared to expression data from normal brain tissue (GTEx data, blue box) and a published cohort of GBMs (TCGA, red box). The upper, middle and lower hinges of the box plot are 75th, 50th and 25th quartiles, the whiskers extend to 1.5× the interquartile range below and above the lower and upper hinge, respectively, and points above or below the whiskers represent outliers. c, Numbers of mutations and predicted epitopes for all study subjects (Supplementary Table 4). Red lines, patients for whom vaccines were generated (n = 8); grey solid line, patient who was removed from the study before vaccine administration owing to progressive disease (n = 1); grey dotted line, patient had an insufficient number of mutations to proceed to vaccine generation (n = 1).
