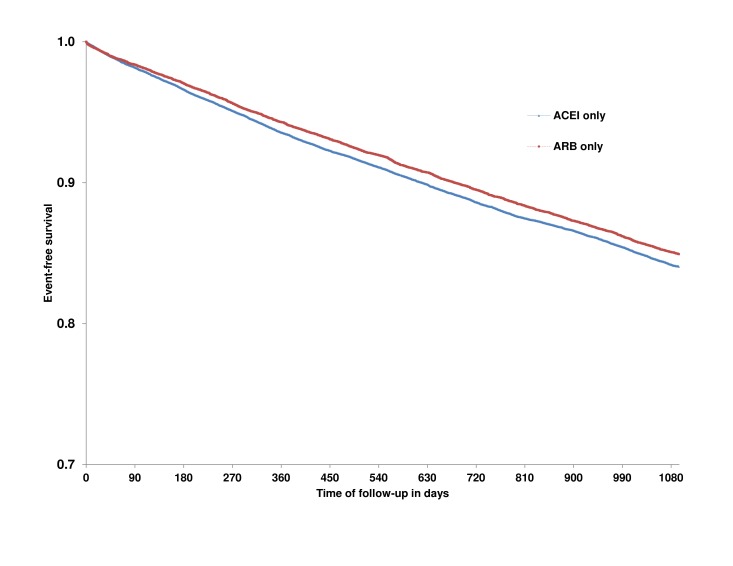
Figure 2.
Kaplan-Meier curve of the primary outcome in patients prescribed ACE inhibitor (ACEI) and angiotensin receptor blocker (ARB). Y-axis shows event rate rates and x-axis shows time in days after assembling the study cohort. Blue line depicts event rates for ACEI and red line depicts event rates for ARBs.

