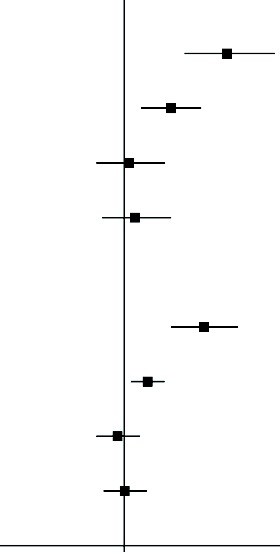
Table 2.
Outcomes in the ACEI and ARB group
| ACEI rate (%) | ARB rate (%) | ARB rate (%) | Forest plot | P value | |
| 1-year follow-up | |||||
| CV death | 3.7 | 2.8 | 1.31 (1.18–1.45) |

|
<0.001 |
| CV death/hospitalisation for MI or angina | 6.5 | 5.7 | 1.14 (1.05–1.23) | <0.001 | |
| Hospitalisation for MI or angina | 3.4 | 3.4 | 1.01 (0.92–1.12) | 0.791 | |
| Hospitalisation for heart failure | 3.3 | 3.2 | 1.03 (0.93–1.14) | 0.541 | |
| 3-year follow-up | |||||
| CV death | 9.9 | 8.6 | 1.16 (1.09–1.23) | <0.001 | |
| CV death/hospitalisation for MI or angina | 16.0 | 15.1 | 1.07 (1.02–1.12) | 0.008 | |
| Hospitalisation for MI or angina | 8.1 | 8.3 | 0.98 (0.92–1.05) | 0.552 | |
| Hospitalisation for heart failure | 8.2 | 8.2 | 1.00 (0.94–1.07) | 0.984 | |
| 0.5 | 1 HR | 1.5 | |||
| Favours ACEIs | Favours ARBs | ||||
Higher HR indicates better outcomes associated with ARBs.
ACEI, ACE inhibitor; ARB, angiotensin receptor blocker; CV, cardiovascular; MI, myocardial infarction.
