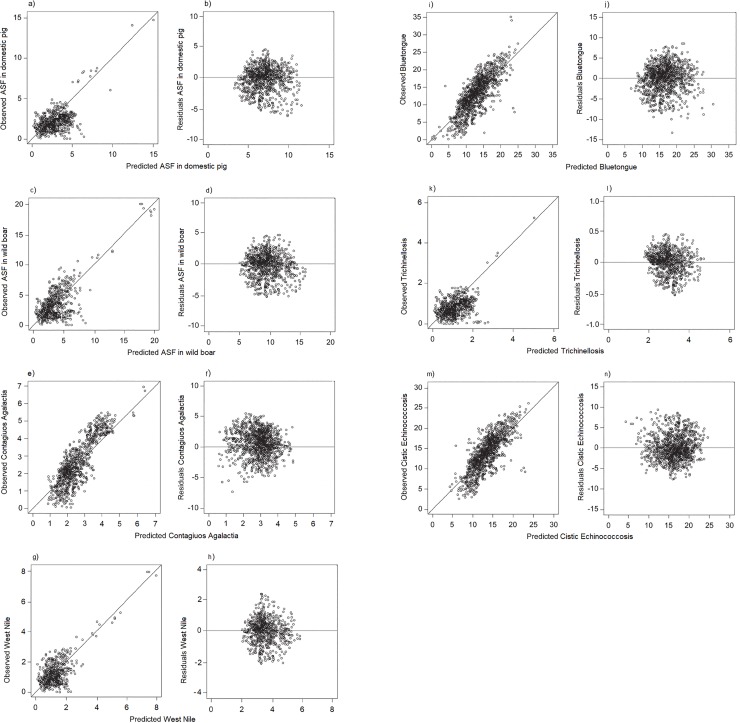
Fig 1.
(a-n). Diagnostic plots of the seven prediction model. Graph (a, c, e, g, i, k, m) shows observed versus predicted values with a line that has zero intercept and slope equal to one. Graph (b, d, f, h, j, l, n) shows residuals versus predicted values. Predicted and residuals were calculated using only the fixed effects. The “hexbin” function in hexbin R-package has been used to separate the overlapped points.

