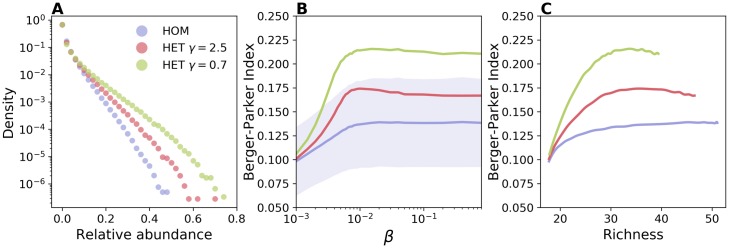
Fig 2. Effect of contact heterogeneity on strain dominance.
(A) Distribution of strains’ relative abundance, i.e. the frequency of strains infecting a given fraction of the total prevalence, for HOM (blue), HET with γ = 2.5 (red), and HET with γ = 0.7 (green). Here β = 0.02. (B) Berger-Parker index, i.e. the relative abundance of the most abundant strain, as a function of β. For the sake of visualization, the shaded area corresponding to the standard deviation is shown only for HOM. Median and confidence intervals are reported in S1 Fig of the supporting information. (C) Berger-Parker index vs richness. Parameters are the same as in Fig 1.

