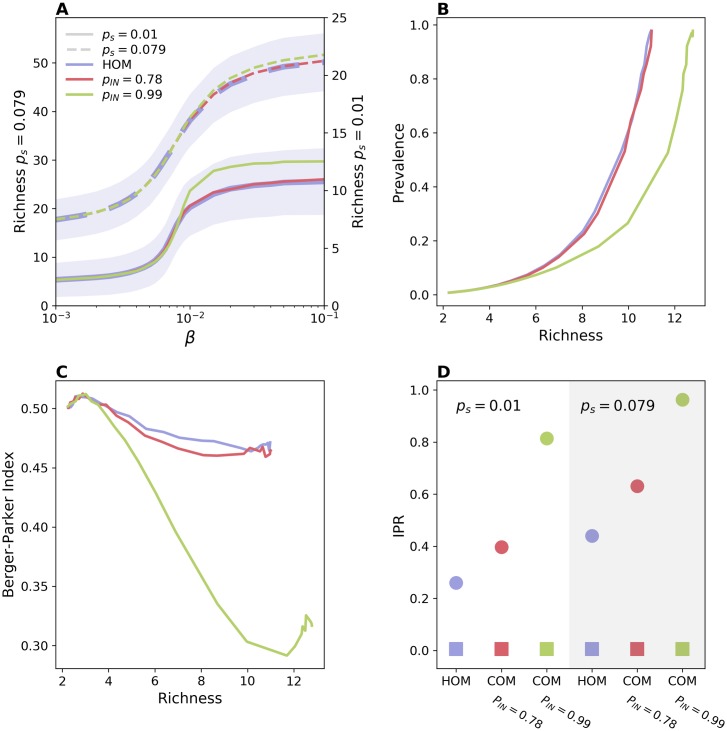
Fig 3. Impact of community structure.
(A) Richness vs β for HOM (blue), COM with pIN = 0.78 (red), and COM with pIN = 0.99 (green). For both COM models we have set nC = 6. Solid lines correspond to ps = 0.01, while dashed lines correspond to ps = 0.079. Solid lines refer to the right y-axis, while dashed ones to the left y-axis. For the sake of visualization, the shaded area corresponding to the standard deviation is shown only for HOM. Median and confidence intervals are reported in S1 Fig of the supporting information. (B) Prevalence vs richness and (C) Berger-Parker index vs richness, for ps = 0.01. (D) Average IPR for both ps = 0.01 (white background) and ps = 0.079 (gray background). Here β = 0.02. Squares correspond to IPR obtained from total prevalence while circles correspond to IPR obtained from strains’ abundances. A value of the IPR close to 1 indicates localization over one community. Here no injection due to transmission from an external source is assumed (qs = 0). The effect of this second mechanism is shown in S6 Fig.

