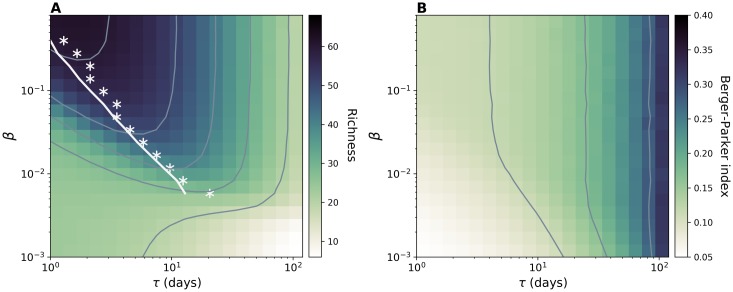
Fig 4. Effects of node length of stay on strain diversity.
(A) Average richness and (B) Average Berger-Parker index for simulations on HOM model. Contour plots are shown in both figures. While exploring τ we also set the value of the average network size to 306, thus the injection rate can be computed by the relation . For each value of β we highlight in panel (A) the value of the length of stay corresponding to the maximum richness (white asterisks) together with the analytical prediction (white line) obtained by using Eq (1). Here μ = 0.00192, , aH = 0.28.

