
Figure 3.
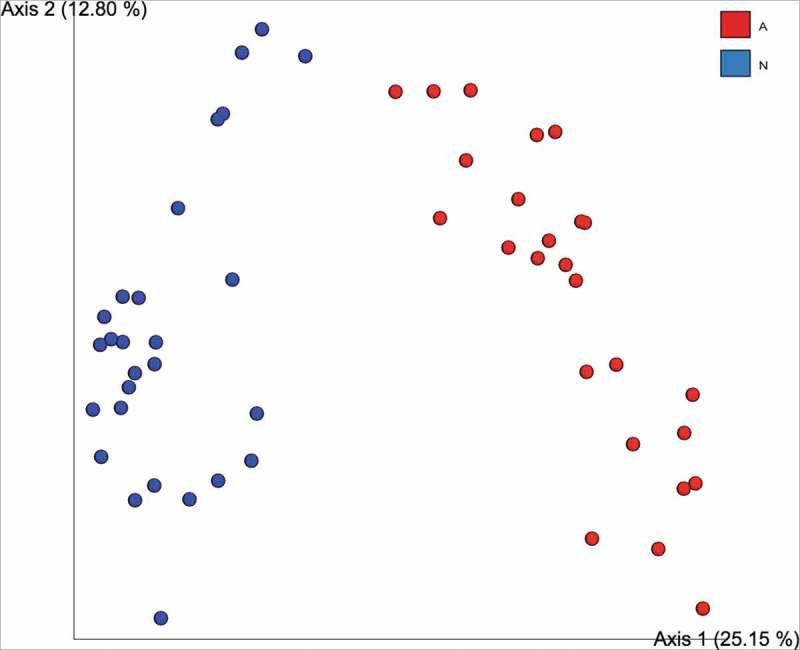
The fecal microbiome clusters to water source in a mouse model of spontaneous colitis. Beta-diversity between two in vivo facilities supplying different water sources to Muc2−/− mice show clear clustering based on Bray-Curtis dissimilarity measures. Red dots represent the UBC Okanagan cohort (receiving acidified water at pH of ~2.3 via the addition of HCL) and blue dots represent the UBC Vancouver cohort (who received autoclaved municipal tap water.).