
Figure 3.
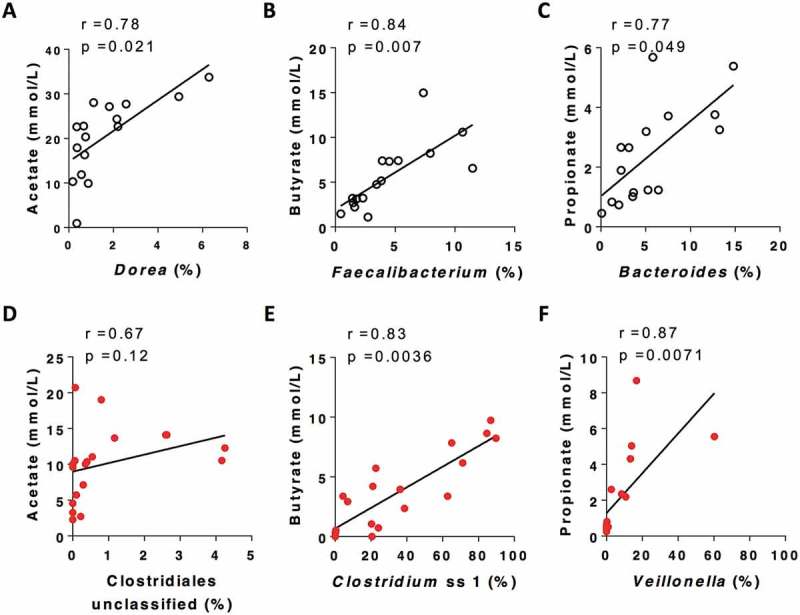
Representative taxa that were most stongly correlated with SCFA concentration post fermentation for non-CF control (black) and CF (red) samples (Full data of correlation between taxa and SCFA is included in Supplementary Figure 3). P values were from spearman correltaion adjusted by Benjamini-Hochberg FDR procedure.