
Figure 2.
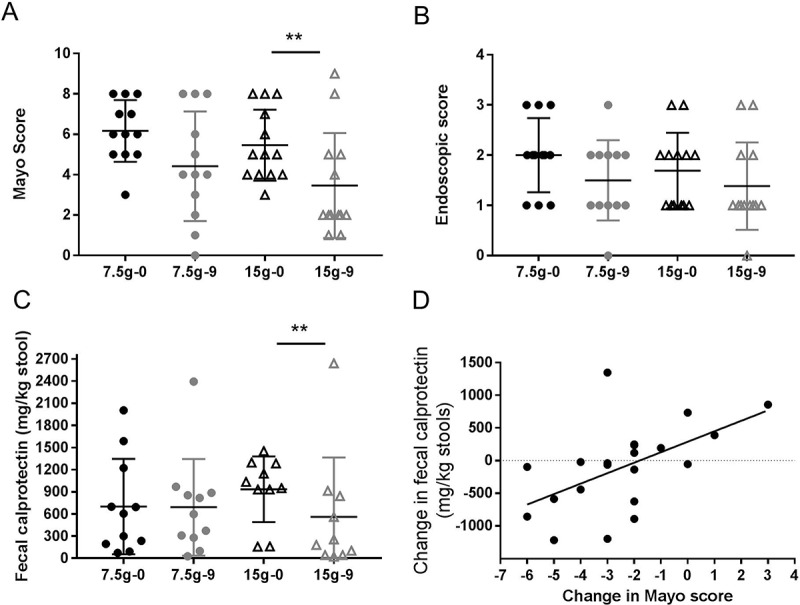
Mayo Clinical Score (A), endoscopic activity score (B) and fecal calprotectin (C) at 0 and 9 weeks for each of the treatment groups (7.5 g/d low dose n = 12; 15 g/d high dose n = 13). Black color – measures at baseline (0 week); grey color – measures at end of the study (9 week); (●) 7.5 g/d low dose; (▲) 15 g/d high dose. Values are shown as scatter plot. “**” Means that significantly different from week 0 (P < 0.05). Spearman correlation analysis between Mayo score and fecal calprotectin (D) (r = 0.58, P = 0.006. Values are expressed as changes in the clinical markers Mayo score and fecal calprotectin at week 9 versus baseline.