
Figure 4.
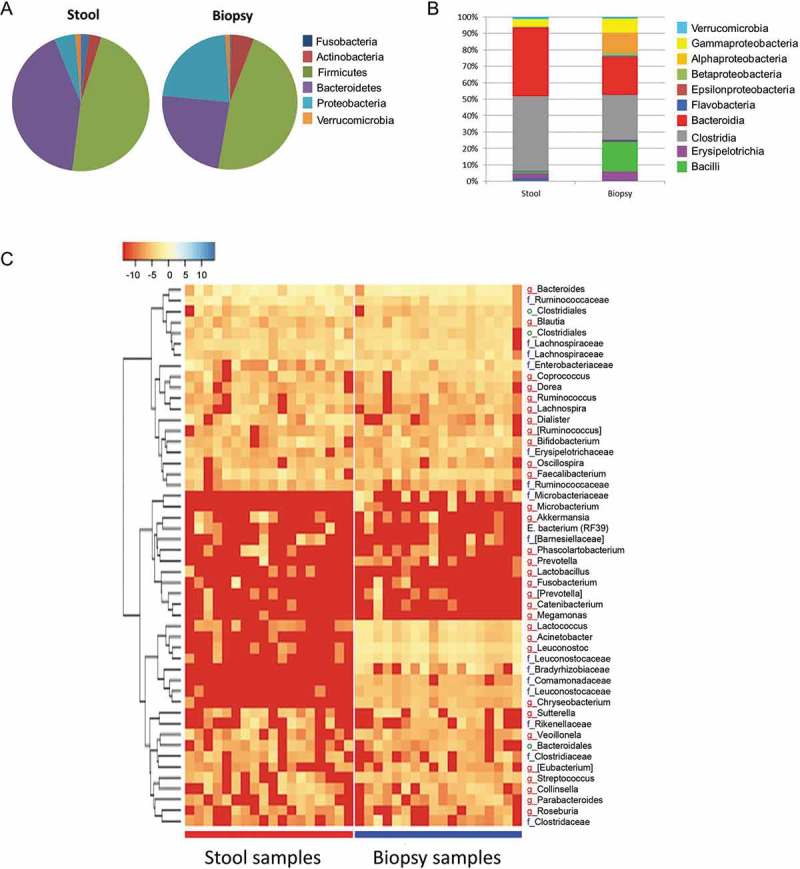
Relative bacterial abundance (%) on (A) phylum and (B) class level in stool and biopsies at baseline (0 week) of UC patients with active mild to moderate disease treated with two doses of inulin-type fructans. (C) Heatmap based on the hierarchical clustering solution (Bray–Curtis distance metric and complete clustering method) of the genus-level microbiota in stool and biopsy samples at baseline (0 week). Rows represent the first 50 dominant genera, columns represent the different subjects. The values in the heatmap represent the square-root-transformed relative percentage of each bacterial genus. The square-root-transformed values for bacterial genus are depicted by colour intensity with the legend indicated at the upper left corner of the figure.