
Figure 12.
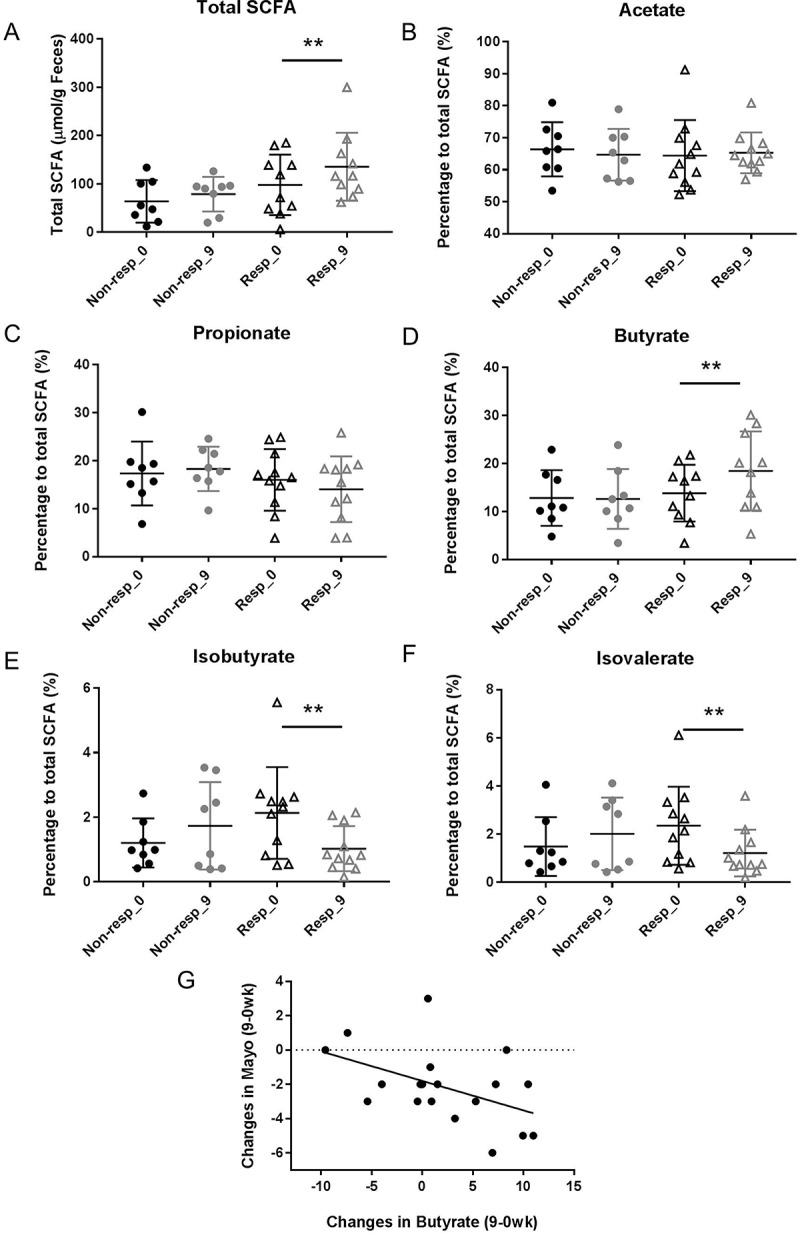
Short chain fatty acids measured in stool samples from patients who showed no clinical improvement (non-responders) (n = 11) and clinical improvement (responders) (n = 14) following treatment with two doses of inulin-type β-fructans for 9 weeks. Individual SCFAs are shown as relative concentrations to total SCFA. Black color – measures at baseline (0 week); grey color – measures at end of the study (9 week); (●) non-responders; (▲) responders. (A) Total SCFA; (B) Acetate; (C) Propionate; (D) Butyrate; (E) Isobutyrate; (F) Isovalerate. “**” Means that significantly different from week 0 (P < 0.05) (Wilcoxon matched-pairs signed rank test); (G) Spearman correlation analysis between the changes in Mayo score and changes in butyrate relative concentrations (r = −0.50, P = 0.036).