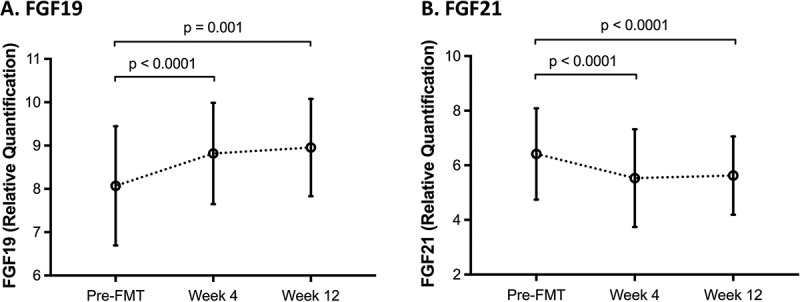
Figure 2.

Normalized Protein eXpression (NPX) values for serum fibroblast growth factor (FGF)19 (A) and FGF21 (B) over time.
There is a statistically significant increase in FGF19 level 4 and 12 weeks after FMT compared to screening, while a statistically significant decrease in FGF21 level is observed 4 and 12 weeks following FMT. X-axis depicts time, and y-axis depicts relative quantification of respective FGF. Circles represent mean; error bars represent standard deviation.
