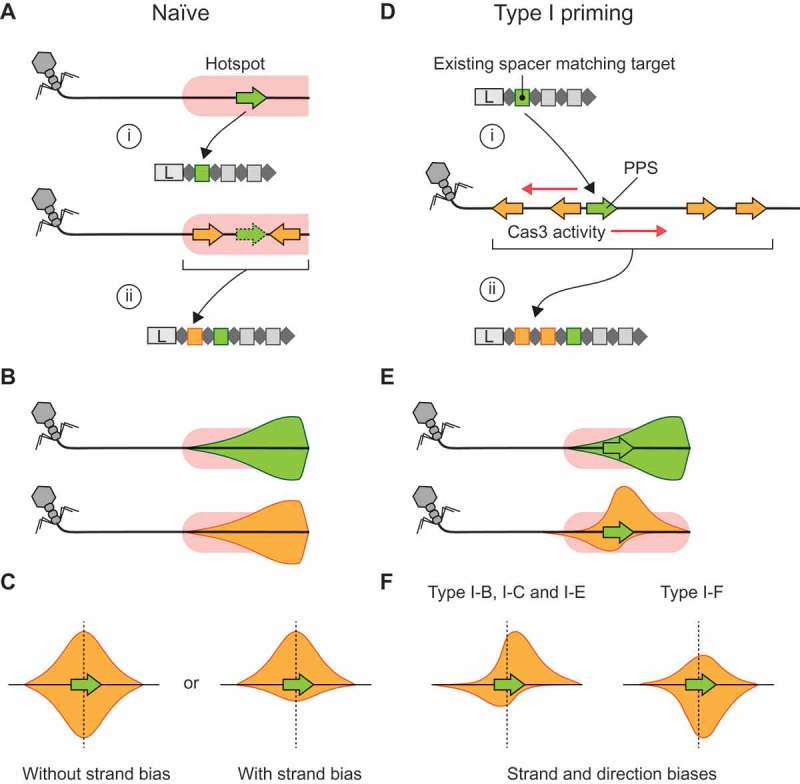
Figure 1.

CRISPR adaptation pathways and the positional relationship between targets of multiple spacers. A) Naïve acquisition of two spacers from a ‘hotspot’ site (pink) where prespacer substrate generation frequently occurs. In this example, the hotspot represents the incoming end of a phage genome [20]. (i) The first spacer acquired (green) comes from within the hotspot. (ii) A subsequent spacer (orange) is also acquired from within the hotspot, but the location of the second spacer is not directly dependent on the location of the first spacer. B) When the first or subsequent spacers from many hotspot-facilitated naïve acquisitions are mapped to the target genome the distributions are expected to be the same (green and orange distributions). In this example, the mapping densities are skewed toward the start of the hotspot, i.e. the incoming end of the phage genome. C) If the relative positions of the first (green) and second (orange) spacer acquisitions are considered, i.e. the distance and direction between their corresponding protospacer mapping locations, the resulting relative protospacer mapping distributions will be symmetric. However, depending on the pathway for spacer substrate generation, there may be a strand bias. D) In type I primed CRISPR adaptation, an existing spacer (green) facilitates target recognition at the corresponding (priming) protospacer (PPS, green) (i) and results in Cas3 and/or Cas1-Cas2 activity initiating at this point, which generates substrates for the acquisition of additional spacers (orange) (ii). Often, multiple spacers are acquired. E) The protospacer mapping distributions for a naïve spacer (green) that subsequently triggers the primed acquisition of additional spacers (orange) differ when compared directly on the phage genome. This results in asymmetry in the relative protospacer mapping distribution (orange). F) The relative protospacer mapping distributions for type I priming are system-specific and vary in strand bias and distance from the priming protospacer. Schematic representations based on previous observations in the type I-B system of Haloarcula hispanica [26], type I-C from Legionella pneumophila [27], type I-E system from Escherichia coli [40] and the type I-F system in Pectobacterium atrosepticum [19] are shown.
