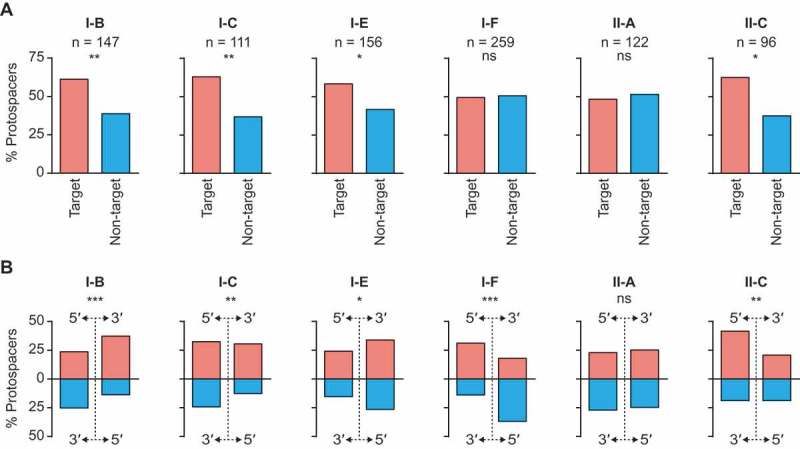
Figure 4.

Type I and II systems display spacer acquisition biases consistent with priming. A) The proportion of protospacers present on each strand for hits within 5 kb either side of their respective priming protospacers. The significance of the differences between strands were determined using a binomial test; p > 0.05 non-significant (ns), p < 0.05 *, <0.01 **, <0.001 ***. B) Directional bias for hits within 5 kb either side of the priming protospacers, summarised by plotting the proportion of protospacers found in each quadrant (strand and direction). The significance of the distributions were determined using a multinomial test; p > 0.05 non-significant (ns), p < 0.05 *, <0.01 **, <0.001 ***. The same analyses were also performed on all data, regardless of distance from the PPS (Fig. S3).
