
Figure 4.
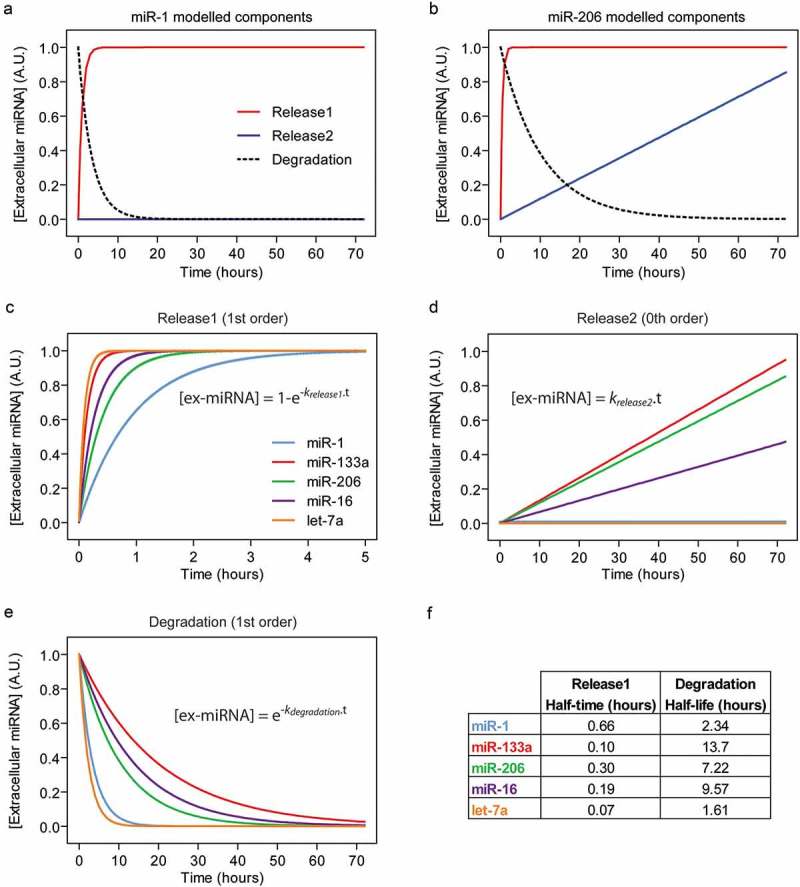
Modelling of extracellular miRNA release kinetics. ex-miRNA release and degradation components were simulated based on a mathematical model fitted to empirical data. The Degradation rate constants were determined using data from Figure 1. The Release1 and Release2 rate constants were determined using data from Figure 3. The three processes contributing to steady-state ex-miRNA levels were plotted separately for two representative miRNAs; (a) miR-1, which exhibits a negligible Release2 component, and (b) miR-206, which exhibits a prominent Release2 component. Simulated data for the three processes contributing to ex-miRNA levels were modelled individually in order to compare miRNAs for (c) the first release process (Release1), (d) the second release process (Release2), and (e) Degradation. Equations used to generate the curves are shown on the plots.