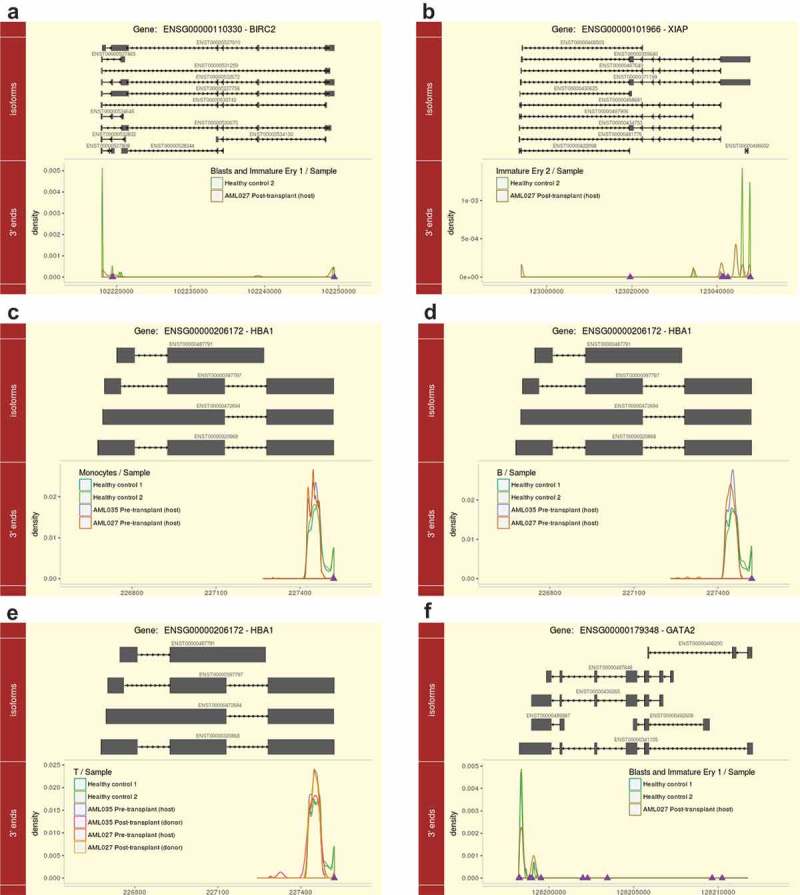
Figure 5.

APA dynamics of IAP-Family genes and cell marker genes in specific samples. (a) BIRC2 in the cell type ‘Blasts and Immature Ery 1ʹ; (b) XIAP in the cell type ‘Immature Ery 2ʹ; (c) HBA1 in the cell type ‘Monocytes’; (d) HBA1 in the cell type ‘B’; (e) HBA1 in the cell type ‘T’; (f) GATA2 in the cell type ‘Blasts and Immature Ery 1ʹ. Lines in different colours represent different samples, and samples with no or extremely low expression of the corresponding gene are not shown. Purple triangles represent the annotated poly(A) sites from PolyA_DB 3.
