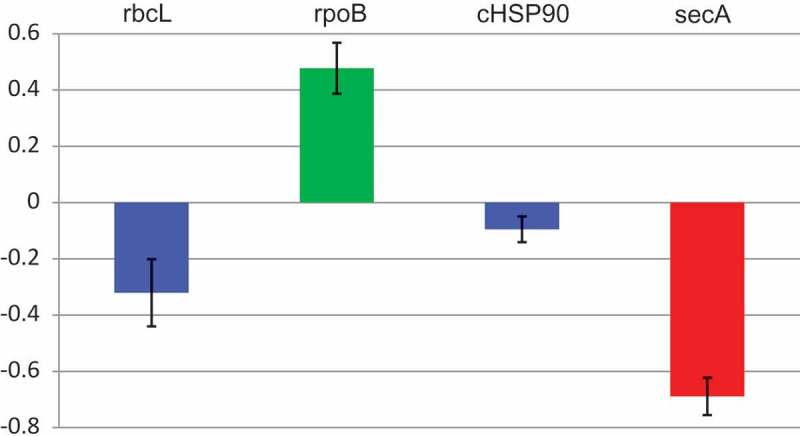
Figure 4.

Levels of rbcL, rpoB, cHSP90 and cpSecA mRNAs in PYM-expressing and non-expressing tissues. RT-qPCR assessment of the transcript level, with respect to that of EF1α, of the four genes in yellow sectors of a PYM-inoculated plant relative to those of green leaves of the same plant. Results are presented in log10 scale. Bars indicate standard errors, with columns in blue denoting that transcript levels do not differ significantly at P ≤ 0.05 according to the Duncan’s multiple-range test, while those in green and red do.
