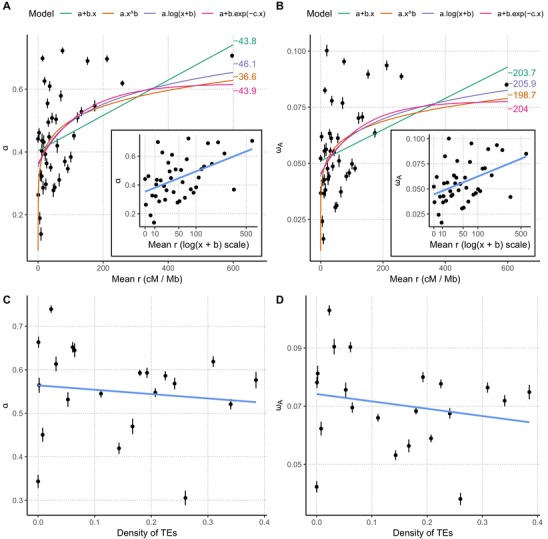
Figure 4.

Estimates of the proportion of adaptive substitutions α, and the rate of adaptive substitution, ωa as a function of the recombination rate (r). (A) α as a function of the r. (B) ωa as a function of r. Each point and bars represent the mean estimate, and corresponding standard error for one recombination category over 100 bootstrap replicates. Four models were fitted (colored curves) and corresponding Akaike's information criterion values are indicated in the right margin. Inset plots represent the same data with a logarithmic scale; the b value was set to the corresponding estimate in the third model. Confidence intervals have been omitted for clarity. (C) and (D) Show the effect of TE density on α and ωa, respectively.
