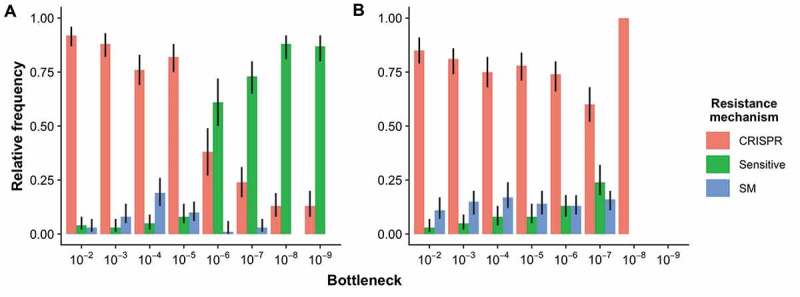
Figure 4.

Evolution of host resistance of the WT strain. Relative frequencies of bacterial clones with CRISPR immunity, surface mutation (SM) resistance, or sensitive phenotypes, at 3 days post-infection when (A) both host and phage were bottlenecked by dilution into fresh medium as indicated on the x-axis s and (B) host was bottlenecked by dilution into fresh medium as indicated on the x-axis and phage was bottlenecked at a fixed 10−2 dilution at each transfer. Error bars correspond to 95% confidence intervals (CIs) of the mean. N = 72 for the 10−6 treatment in panel A, and N = 48 for the 10−8 treatment in panel B. No bacterial cells were recovered from any replicate in the 10−9 treatment in panel B. N = 144 for all other treatments.
