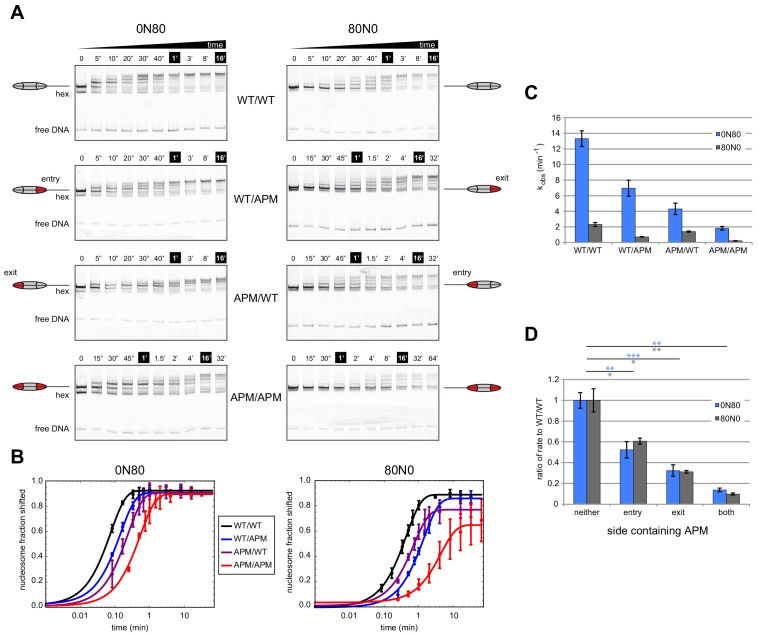
Figure 2. Mutations in the acidic patch slow down but do not disrupt centering ability of Chd1.
(A) Native gel nucleosome sliding assays using Chd1, with all four arrangements of APM and WT H2A/H2B dimers. Depending on which side the flanking DNA was on, the unique APM dimers were either on entry or exit sides, as indicated. The positions of the nucleosome cartoons indicate end-positioned nucleosomes in the gel, with the lower band representing residual hexasomes. Nucleosome centering is evidenced by slower migration in the gel. Reactions contained 40 nM hexasome, 60 nM H2A/H2B dimer, 200 nM Chd1, and 100 µM ATP. Note the different time series used (indicated above each gel), which helped capture sliding intermediates given the different reaction rates. Results are representative of three independent replicates. (B) Quantified data from (A) plotting the disappearance of end-positioned nucleosomes, overlaid with single exponential fits. The end-positioned band intensity was normalized to the total band intensity within each lane. Error bars show standard deviations from three replicates. (C) Mean observed rates ± standard deviations from fits obtained in (B). (D) Relative impact of APMs on Chd1 remodeling rates. Remodeling rates for WT/WT 0N80 and 80N0 were each scaled to 1. Rates for nucleosomes containing APM substitutions were scaled relative to WT/WT made with the same DNA construct. P-values *≤0.02; **<0.005; ***<0.0005.

