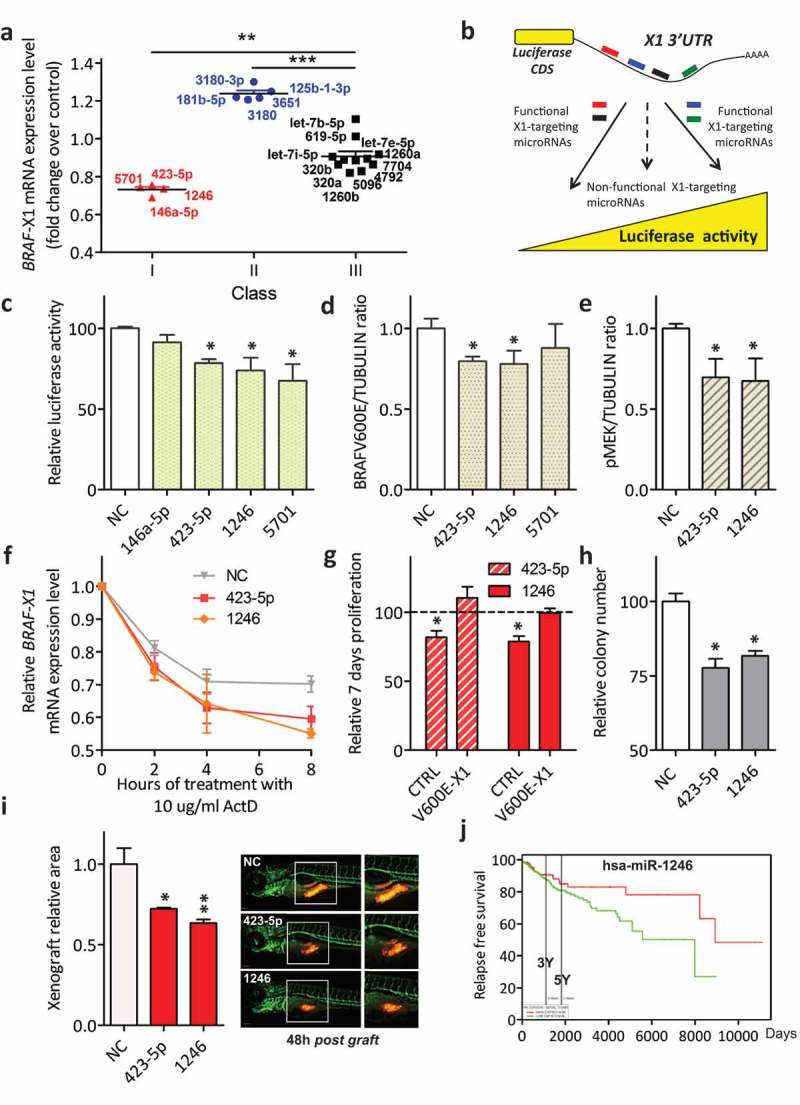
Figure 3.

Classification of BRAFV600E-X1-binding microRNAs and functional validation of those that cause a decrease in BRAFV600E-X1 mRNA levels (Class I).
(a). The 20 microRNAs identified using miR-CATCHv2.0 were transiently transfected as si-miRNAs into A375 cells and were stratified in three different classes, according to the effect that they elicit on BRAFV600E-X1 mRNA levels 24 h later. Class I microRNAs (red) cause a ≥ 20% decrease in BRAFV600E-X1 mRNA levels compared to si-NC; Class II microRNAs (blue) cause a ≥ 20% increase in BRAFV600E-X1 mRNA levels; Class III microRNAs (black) do not alter BRAFV600E-X1 mRNA levels.
(b). Schematic representation of the Luciferase reporter assay. The pMIR-X1-3ʹUTR plasmid, in which the X1 3ʹUTR is cloned downstream of a Luciferase CDS, is transfected in HCT116 Dicer-/- cells together with the appropriate si-miRNAs. If a si-miRNA is functional, a decrease or increase in Luciferase activity is observed.
(c). miR-423-5p, miR-1246 and miR-5701 Class I microRNAs are functional because they cause a decrease in Luciferase activity.
(d-e). Quantification of BRAFV600E (d) and pMEK (e) protein levels, as detected by immunoblot 48 h after the transfection of si-miR-423-5p, si-miR-1246 and si-miR-5701 in A375 melanoma cells.
(f). Real-time PCR quantification of BRAF-X1 mRNA in A375 cells that were first transfected with the indicated siRNAs and 24 h later treated with 10 ug/ml Actinomycin D (ActD) for the indicated number of hours.
(g). Effect of the overexpression of miR-423-5p and miR-1246 on the proliferation of A375 melanoma cells and dependency on BRAFV600E-X1. Compared to si-NC, the transfection of si-miR-423-5p and si-miR-1246 causes a decrease in cell proliferation. Such a decrease is abrogated by the concomitant overexpression of the microRNA-insensitive BRAFV600E-X1 CDS, which indicates that it depends on the targeting of this protein. CTRL: A375 cells stably infected with the empty pCW lentiviral vector, transfected with si-miR-619-5p or si-let-7b-5p and induced with 2 ug/ml doxycycline for 48 h. V600E-X1: A375 cells stably infected with pCW-BRAFV600E-X1-CDS lentiviral vector, transfected with si-miR-619-5p or si-let-7b-5p and induced with 2 ug/ml doxycycline for 48 h. The proliferation of A375 cells stably infected with pCW-BRAFV600E-X1-CDS lentiviral vector, transfected with si-NC and induced with 2 ug/ml doxycycline for 48 h did not show a statistically significant difference compared to the proliferation of A375 cells stably infected with the empty pCW lentiviral vector, transfected with si-NC and induced with 2 ug/ml doxycycline for 48 h (which was taken as reference for all the other experimental conditions).
(h). Effect of the overexpression of miR-423-5p and miR-1246 on the colony forming ability of A375 melanoma cells.
(i). Effect of the overexpression of miR-423-5p and miR-1246 on the growth of A375-mCherry cells xenografted in zebrafish embryos. About 48 h after the transfection with si-miR-423-5p or si-miR-1246, cells were injected in 48 h post fertilization embryos and allowed to grow for an additional 48 h. At the end of this period, the size of the red cell masses was measured. The pictures are taken from 1 out of 3 independent experiments performed, all with comparable outcome. Scale bar: 100 um. The graphs in this figure represent the mean ± SEM of three independent experiments. *p < 0.05, **p < 0.01, ***p < 0.001.
(j). In the skin cutaneous melanoma dataset available at TCGA, patients with higher levels of miR-1246 (above the mean, red) show a better relapse free survival than patients with lower levels of miR-1246 (below the mean, green). n = 501. Samples above the mean: 160, 19 events. Samples below the mean: 341, 60 events. p = 0.0499.
