Figure 4.

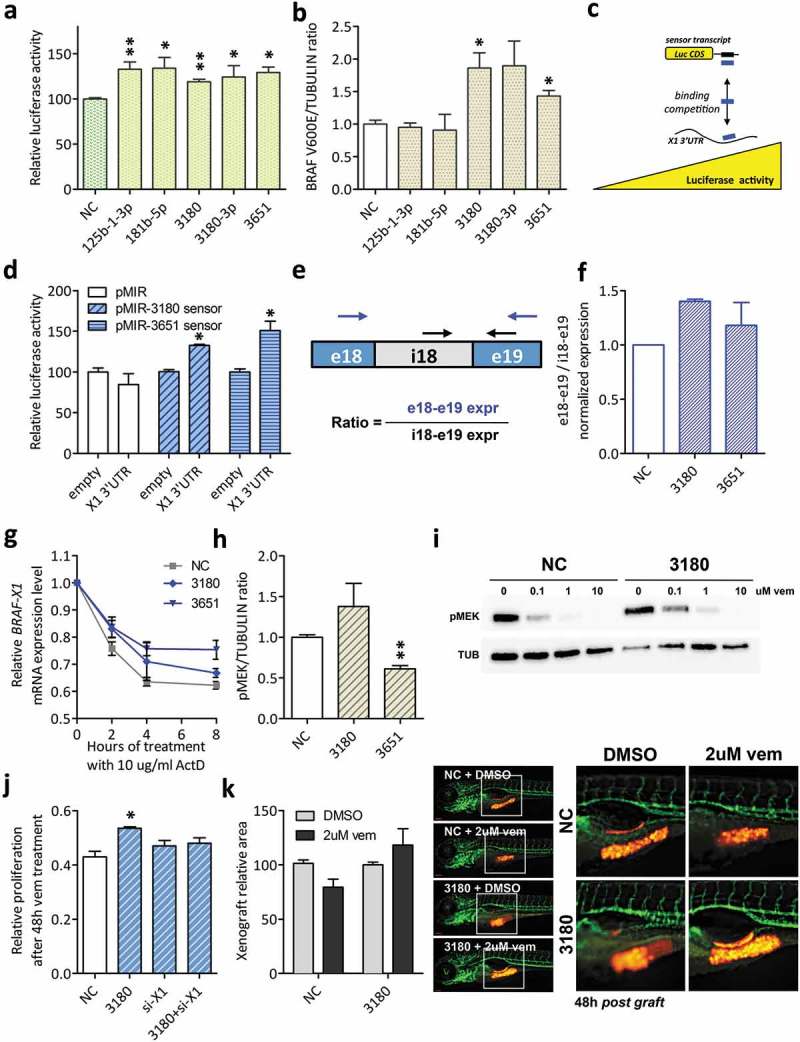
Functional validation of BRAFV600E-X1-binding microRNAs that cause an increase in BRAFV600E-X1 mRNA levels (Class II).
(a). Luciferase assay performed in HCT116 Dicer-/- cells indicates that miR-125b-1-3p, miR-181b-5p, miR-3180, miR-3180-3p and miR-3651 are functional, as they cause an increase in reporter gene activity.
(b). Quantification of BRAFV600E protein levels, as detected by immunoblot 48 h after the transfection of si-miR-125b-1-3p, si-miR-181b-5p, si-miR-3180, si-miR-3180-3p and si-miR-3651 in A375 melanoma cells.
(c–d). Sensor constructs for miR-3180 and miR-3651. (c). Schematic representation of the use of sensor constructs for X1-binding microRNAs. If the X1 3ʹUTR binds to a given microRNA species, the corresponding sensor transcript is released and an increase in Luciferase activity is observed. Blue rectangle: microRNA under study. Black rectangle: sequence complementary to that of the microRNA, expressed downstream of Luciferase CDS. (d). The sensor constructs for miR-3180 and miR-3651 show an increase in Luciferase activity in the presence of the X1 3ʹUTR, confirming its ability to bind to these microRNAs.
(e–f). The ratio between the expression level of exon 18 – exon 19 (taken as measure of mature BRAFV600E-X1 mRNA) and the expression level of intron 18 – exon 19 (taken as measure of BRAFV600E-X1 primary transcript) increases in the presence of si-miR-3180 and si-miR-3651. In (e), the position of the qRT-PCR primer pairs used is indicated by arrows (blue for e18-e19 and black for i18-e19). In (f), the results of real-time PCR analysis performed on A375 cells transfected with the indicated siRNAs are reported.
(g). Real-time PCR quantification of BRAF-X1 mRNA in A375 cells that were first transfected with the indicated siRNAs and 24 h later treated with 10 ug/ml Actinomycin D (ActD) for the indicated number of hours.
(h). Quantification of pMEK protein levels, as detected by immunoblot 48 h after the transfection of si-miR-3180 and si-miR-3651 in A375 melanoma cells.
(i). Immunoblot of pMEK performed on A375 cells that were transfected with si-NC or si-miR-3180 and 48 h later treated with the indicated doses of vemurafenib for 1 h.
(j). Effect of the overexpression of si-miR-3180 on the proliferation of A375 melanoma cells in presence of vem and dependency on BRAFV600E-X1. A375 cells were transfected with si-NC, si-miR-3180, si-X1 or si-miR-3180 + si-X1, treated with 2 uM vemurafenib for 48 h and then allowed to grow for 7 days. Compared to si-NC, the transfection of si-miR-3180 causes an increase in resistance of A375 cells to vem (measured as increase in proliferation). Such effect is abrogated by the concomitant knock-down of BRAFV600E-X1 by means of the co-transfection of si-X1 (an siRNA that targets the 3ʹUTR of BRAF-X1 mRNA [21]), which in turn indicates that the microRNA acts by targeting this protein.
(k). Effect of the overexpression of si-miR-3180 on the growth of A375-mCherry cells xenografted in zebrafish embryos. Cells were transfected with si-miR-3180 and treated with 2 uM vemurafenib for 48 h. They were then injected in 48 h post fertilization embryos and allowed to grow for an additional 48 h. At the end of this period, the size of red cell masses was measured (left). The pictures on the right are taken from one out of three independent experiments performed, all with comparable outcome. Scale bar: 100 um. The graphs in this figure represent the mean ± SEM of three independent experiments. *p < 0.05, **p < 0.01.
