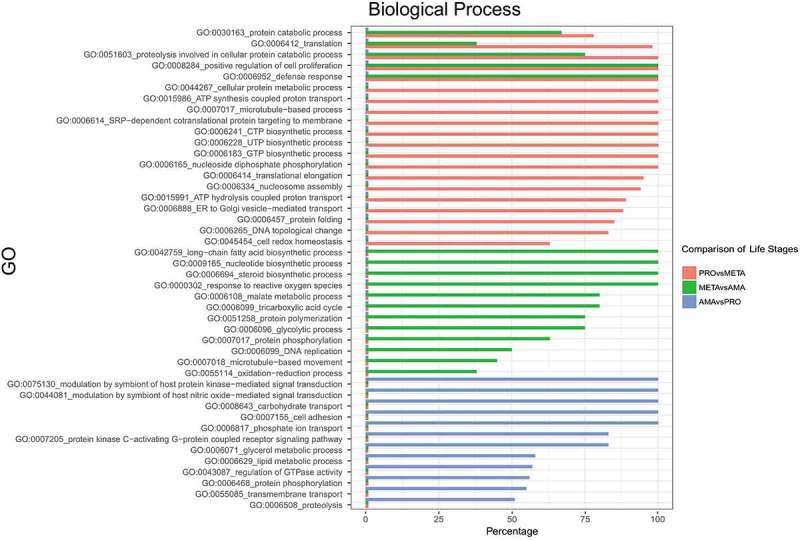
Figure 3.

Gene ontology enrichment analysis. Biological processes enriched in genes upregulated in the life cycle stages of L. braziliensis (adjusted p value ≤ 0.05) are shown. Red bars: biological processes upregulated in PRO compared to META. Green bars: biological processes upregulated in META compared to AMA, and blue bars: biological processes upregulated in AMA compared to PRO. The x-axis percentage represents the fraction (%) of genes upregulated within the set of all genes from Leishmania assigned to the corresponding biological process.
