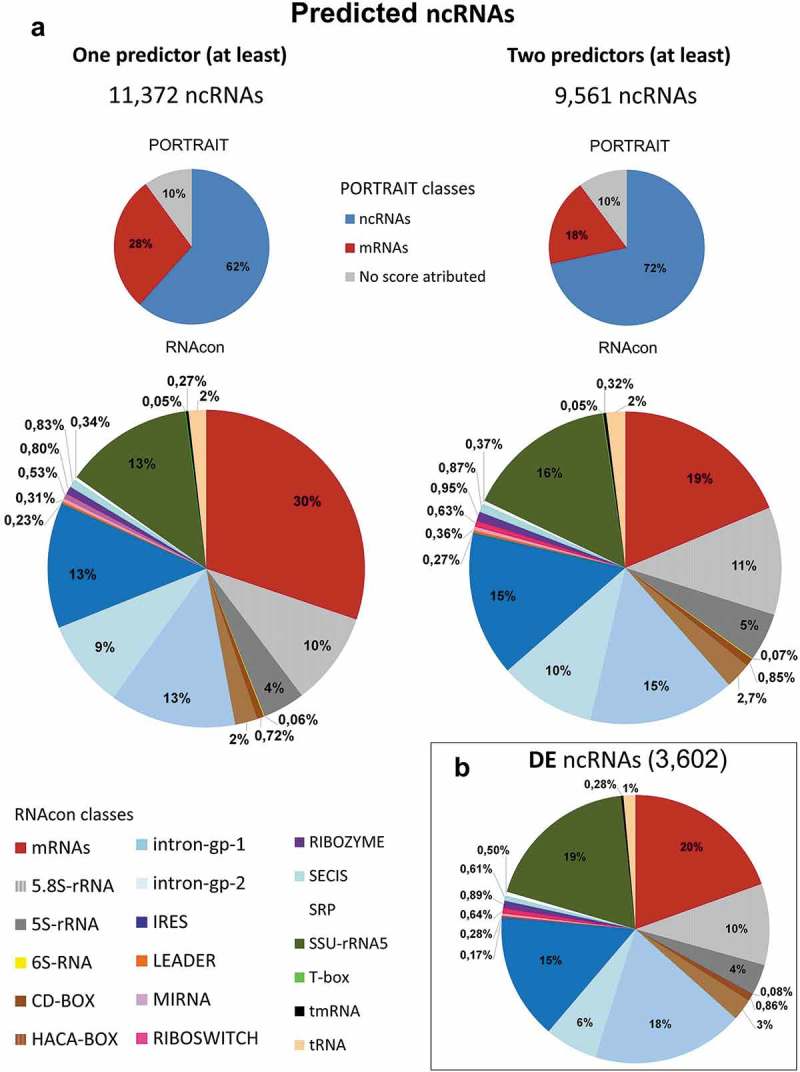
Figure 5.

Graphic representation of predicted putative ncRNAs. The in silico identified putative ncRNAs were submitted to five ncRNAs predictors (see Methods). Results from Portrait, which estimates coding and noncoding potential of the transcript, and RNAcon, which discriminates between coding and noncoding RNAs and classifies the ncRNAs under 18 different ncRNAs classes, are presented. (a) On the left, the 11,372 putative ncRNAs that had been predicted by at least one of the 5 predictors are distributed in PORTRAIT classes (pie on the top) and RNAcon classes (pie on the bottom). On the right, in a similar organization, the 9,561ncRNAs predicted by at least two of the 5 programs are depicted and distributed among the different classes. (b) Those differentially expressed (DE) putative ncRNAs (3,602, FC ≥ 1.5) predicted at least by two of the 5 programs are depicted under the RNAcon 18 classes. Portrait and RNAcon classes are color-coded and presented in the figure. The gray ‘no score attributed’ indicates that the transcript is neither ncRNA nor mRNA according to Portrait classification.
