
Figure 2.
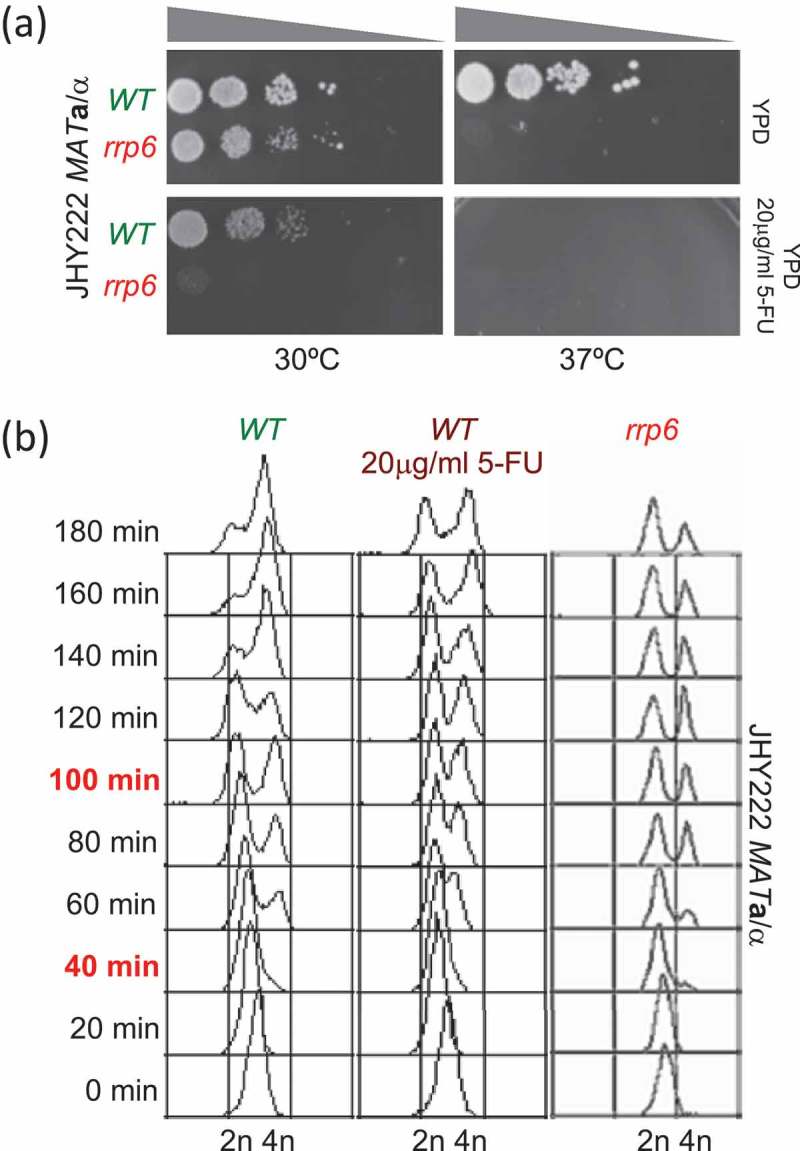
Monitoring cell growth and DNA replication. (A) Images show the outcome of a plate growth assay after 48 hours at the temperatures indicated at the bottom on rich medium (YPD) at permissive (30ºC) and restrictive temperatures (37ºC) for wild type (WT in green) and mutant (rrp6 in red) cells in the strain indicated to the left. The drug concentration is given to the right. Grey triangles at the top indicate increasing dilution of the cell suspension. (B) The output of a FACS analysis is given. The time points are given in minutes and are shown to the left; the samples that were further analysed are shown in red. Color-coded untreated wild type (WT in green), treated wild type (WT 20µg/ml 5-FU in purple) and mutant (rrp6 in red) cell samples are shown at the top. DNA content and strain background are given at the bottom and to the right, respectively.