
Figure 3.
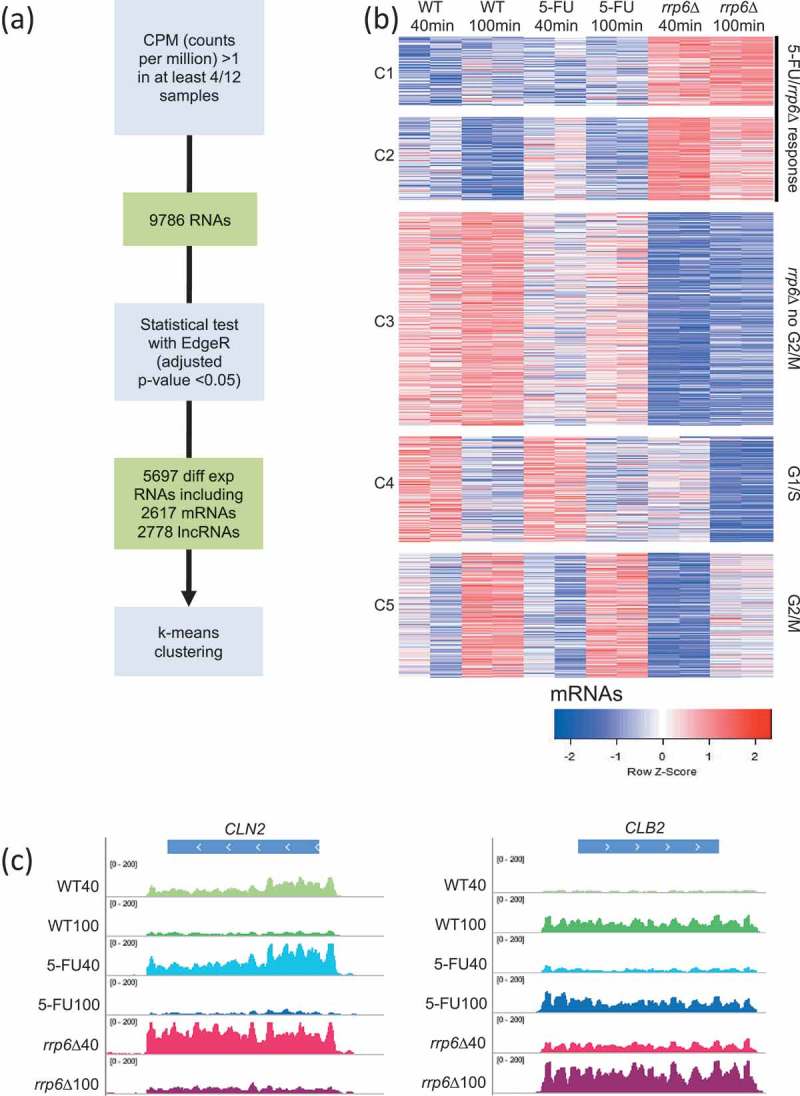
RNA-Sequencing analysis strategy and output. (A) A flow chart outlines the RNA-Seq data analysis strategy. (B) A color-coded heatmap (red is high and blue is low) shows the expression patterns for protein-coding RNAs (mRNAs) grouped into five clusters (C1-C5) given to the left for sample duplicates from wild type (WT), treated wild type (5-FU) and mutant (rrp6∆) cells as shown at the top. The time points are indicated in minutes. The clusters are biologically classified into genes that respond to treatment and gene deletion (5-FU/rrp6∆), gene deletion (rrp6∆) and cell cycle peaks (G1/S and G2/M). A color scale is shown at the bottom. (C) Color-coded histograms are shown for G1/S and G2/M marker genes as given at the top. The sequence (x-axis) is plotted against expression signals (y-axis) for wild type cells (WT40, WT100, shades of green), treated cells (5-FU40, 50-FU100, shades of blue) and mutant cells (rrp6∆40, rrp6∆100, shades of red) at 40 and 100 minutes after release into fresh medium. The data range set in IGV is indicated.