Figure 5.

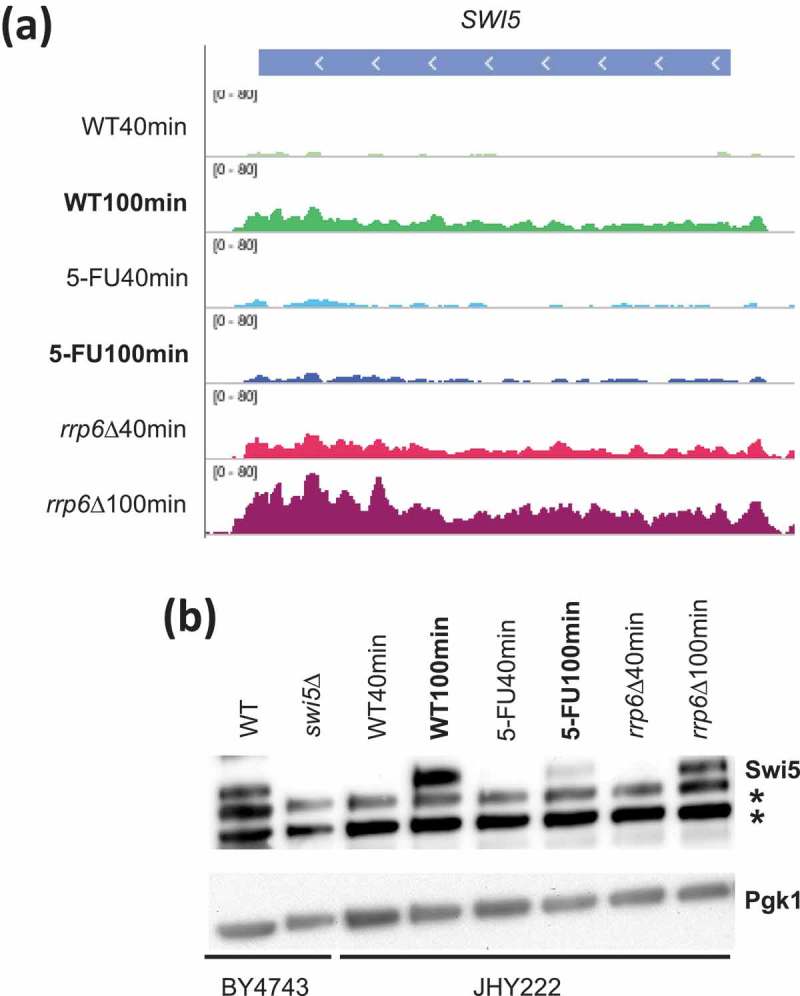
SWI5 RNA and protein analysis. (a) A histogram is shown for SWI5 like in Figure 3C. (b) A Western blot assay is shown for Swi5 in strain backgrounds indicated at the bottom. Pgk1 was used as a loading control. Non-specific bands are indicated with an asterisk to the right. Lanes 1 and 2 contain samples from wild type (WT) and swi5 deletion (swi5∆) strains. Lanes 3–8 contain wild type cells (WT40min, WT100min), treated cells (5-FU40min, 50-FU100min) and mutant cells (rrp6∆40min, rrp6∆100min) 40 and 100 minutes after release into fresh medium.
