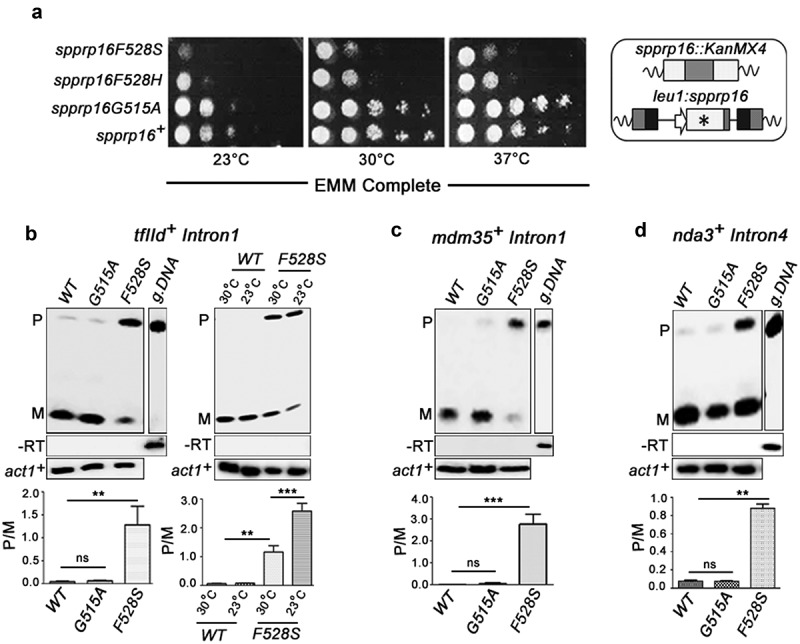
Figure 1.

spprp16F528S mutant affects splicing of introns with diverse features. (a) Growth kinetics of wild-type (WT) and mutants (F528S, F528H and G515A) on EMM complete media at 23°C, 30°C and 37°C analysed by spotting 10-fold serial dilutions of cultures grown to OD595 of 0.7. Schematic representation of the wild-type (leu1:spprp16+) and mutant strains (leu1:spprp16) generated is shown. (b) Semi-quantitative RT-PCRs showing the splicing of tfIId+I1 in WT, spprp16G515A and spprp16F528S cells grown at 30°C. Comparison of tfIId+I1 splicing in the WT and spprp16F528S mutant at 30°C and 23°C is also shown. (C and D) Semi-quantitative RT-PCRs showing the splicing of mdm35+I1 (c) and nda3+I4 (d) in WT, spprp16G515A and spprp16F528S cells grown at 30°C. Reverse transcription for each transcript was done with the reverse primer (RP) corresponding to the downstream exon. PCR on the cDNA was performed with the same RP in combination with upstream exonic forward primer (FP). RT-PCR on the intronless actin transcript (act1+) served as normalization control. P- pre-mRNA, M – mRNA and g. DNA – genomic DNA control as indicated. Bar graphs represent data from three biological replicates. In this and other quantitative assays, the statistical significance was determined by unpaired student’s t-test . *** = p < 0.001, ** p < 0.005, * = p < 0.05 and ns = non-significant.
